



Turkey’s 2023 Socioeconomic Status (SES) report reveals the stark reality of the country's socioeconomic structure: while prosperity is concentrated in a narrow minority, large masses are increasingly trapped in fragile income groups. This study, based on TurkStat data, exposes vast disparities at the provincial and district levels, proving the existence of two separate worlds even within the same city. While relatively high levels of prosperity are seen in industrial and service hubs, poverty emerges as a permanent reality in rural and disadvantaged regions. The SES map not only reflects today's picture but also provides a critical roadmap for urgent steps that must be taken, from education to employment, and from regional development to social justice.
Contrary to the "colorful" tables presented by TurkStat for years, the 2023 Socioeconomic Status (SES) report reveals an unvarnished picture: in Turkey, the rich are few, and the poor are many. Published on August 18, 2025, and covering more than 26 million households, this study laid out the country's prosperity map province by province and district by district. The report, prepared based on household income levels, average education duration, and occupational information, used 2022–2024 data, with 2023 set as the reference year. In the research covering 81 provinces and 973 districts, households were divided into 7 groups to show socioeconomic differences more clearly: A+ (top), A (upper), B (upper-lower), C1 (upper-middle), C2 (lower-middle), D (lower), and E (lowest).
THE NARROWING CIRCLE OF PROSPERITY: COMFORT FOR THE MINORITY, FRAGILITY FOR THE MAJORITY
Contrary to expressions like "growing economy" and "increase in prosperity" frequently voiced in political discourse, the report shows that a large part of Turkey is struggling to make ends meet, while a segment looks at this picture from quite a distance. The data presented by the report reveals that large segments of society are squeezed into middle and lower socioeconomic groups, while those living at high standards are few and far between. In other words, the Turkey we see in luxury housing estates, shopping mall cafes, or airport lounges is actually a Turkey lived in by a very small minority. For the vast majority, the reality is quite different.
The data reveals that households in the top income group across Turkey account for only 1.1%. Households in the upper group are at the 11% level. In other words, while only 12.1% of society has relatively comfortable and high living standards, the remaining vast majority is distributed among lower income groups. Looking at other income groups, 16.4% are in the upper-lower group, 19.7% in the upper-middle group, 16.5% in the lower-middle group, and 18.6% in the lower group. Households in the lowest income group stand out with a rate of 16.7%. This picture clearly reveals that prosperity in Turkey is actually concentrated in a very narrow segment and that large segments of society are gathered in economically fragile groups.
MINORITY PROSPERITY IN METROPOLISES, WIDESPREAD POVERTY IN ANATOLIA
Looking at the provinces, it is seen that 2.5% of households in Ankara are in the top group, 16.5% in the upper group, 20% in the upper-lower group, 17.5% in the upper-middle group, 17.4% in the lower-middle group, 14% in the lower group, and 12.2% in the lowest group.
The picture is similar in Istanbul; 2.4% are in the top group, 16.4% in the upper group, 19% in the upper-lower group, 18.6% in the upper-middle group, 17.2% in the lower-middle group, 13.8% in the lower group, and 12.6% are in the lowest group.
While rates in the upper income group decrease in Izmir, the prevalence of poverty increases: only 1.2% are in the top group, 12.4% in the upper group, 17.6% in the upper-lower group, 18.8% in the upper-middle group, 17.8% in the lower-middle group, 17.1% in the lower group, and 15% are in the lowest group.
In Bursa, these rates are reflected as 0.8% in the top group, 11.3% in the upper group, 17.5% in the upper-lower group, 20.3% in the upper-middle group, 18.2% in the lower-middle group, 17% in the lower group, and 15% in the lowest group.
In Adana, 0.7% are in the top group, 9.5% in the upper group, 15.3% in the upper-lower group, 20.4% in the upper-middle group, 16.4% in the lower-middle group, 20.5% in the lower group, and 17.1% are in the lowest group.
While these data reveal that the economic divide is deepening even in Turkey's large cities, they also clearly show that a sharp polarization persists in the fields of income and education.
Provinces where prosperity is centrally concentrated are quite limited. Across Turkey, 28.6% of households in the top income group are in Istanbul, 11.5% in Ankara, and 6.7% in Izmir. The share of other large cities is much lower: Bursa 3.9%, Antalya 3.3%, and Adana only 2.1%. In other words, while prosperity is shared among a limited minority even in the three major metropolises, different shades of poverty are experienced in the rest of Anatolia.
When descending to the district level, the picture becomes much more striking. The district with the highest income and education profile across Turkey is the Çankaya district of Ankara with a rate of 4.1%. It is followed by Kadıköy from Istanbul (2.4%) and Yenimahalle again from Ankara (1.9%). These districts are distinctly separated from other regions in terms of living standards, education level, and average income. However, at the other end of the spectrum are the districts where poverty is concentrated: Çamoluk in Giresun, Doğanşar in Sivas, Bayramören in Çankırı, and Felahiye in Kayseri stand out among the regions with the lowest socioeconomic levels. In these districts, serious structural problems are experienced in many areas, from access to basic services to education.
TURKEY'S SOCIOECONOMIC LEAGUE TABLE
When ranked according to average socioeconomic level scores, the top 10 provinces with the highest scores are Ankara (150), Istanbul (148), Kocaeli (146), Izmir (138), Bursa (137), Eskişehir (136), Tekirdağ (135), Antalya (135), Muğla (135), and Sakarya (133), while Adana was able to take 18th place with 129 points, and Mersin 26th place with 127 points. In contrast, the last 10 provinces with the lowest scores are Sinop (112), Yozgat (113), Şanlıurfa (113), Gümüşhane (115), Ağrı (115), Kastamonu (115), Çorum (115), Niğde (117), Çankırı (117), and Aksaray (117), respectively.
When ranked according to average socioeconomic level scores, the top 10 districts with the highest scores are Çankaya (178), Kadıköy (176), Beşiktaş (175), Etimesgut (168), Nilüfer (166), Bakırköy (164), Güzelbahçe (164), Maltepe (163), Üsküdar (163), and Ataşehir (162), respectively. In contrast, Çamoluk (Giresun) and Derebucak (Konya) with 81, Doğanşar (Sivas) with 82, Felahiye (Kayseri) with 83, Dikmen (Sinop) and Pınarbaşı (Kastamonu) with 84, and Bayramören (Çankırı) with 85 points are at the bottom of the list. These differences are not just statistics; they are real indicators revealing that there are chasms in the quality of life of citizens living in different regions of the same country.
In light of all this data, the SES report has essentially taken an X-ray of the socioeconomic structure in Turkey. The concentration of prosperity in certain centers and the spread of low income across most of Anatolia point to a serious regional fracture in Turkey's social and economic structure. The SES data does not just tell the story of today; it also once again reveals how urgent the steps that need to be taken regarding social justice, education policies, and regional development are.
TWO SEPARATE WORLDS IN BURSA: THE PROSPERITY OF NİLÜFER, THE POVERTY OF MOUNTAIN DISTRICTS
Bursa's average SES score is 137, and there are more than 1 million households in the city. While 12.1% of households are in the top and upper groups, 32% are in the lower and lowest groups. In line with this data, Bursa ranks 5th after Ankara, Istanbul, Kocaeli, and Izmir. The number of households in the top group is 7,852, and this figure corresponds to 0.8% of the total number of households. In this area, Bursa was recorded as the 4th province with the most households in the top group after Istanbul, Ankara, and Izmir. While the number of households in the upper group was 114,750, 176,701 households were classified in the upper-lower group, and 205,582 households in the upper-middle group. In contrast, it was observed that a large portion of the 504,476 households in Bursa are in lower categories from a socioeconomic perspective. The distribution of these households was as follows: 184,070 households are in the lower-middle group, 169,787 households in the lower group, and 150,619 households in the lowest group.
The Nilüfer district's average SES score is 166, and it ranks 5th among the districts with the highest scores in Turkey. It is also a center where 28% of the population is in the upper income group and 31.6% is in the middle income group. The high level of education and the strength of the industrial and service sectors increase the level of prosperity in the district. The Osmangazi district, with an average SES score of 136 and 123rd place, is concentrated in the middle income group with 41.9% and the lower income group with 16.4%, while the Yıldırım district, with an average SES score of 130 and 200th place, is concentrated in the middle income group with 41.1% and the lower income group with 18.9%; although urban growth continues, social inequalities are clearly felt. The Büyükorhan district, with an average SES score of 92 and 946th place, and the Keles and Harmancık districts, with an average SES score of 102, rank 804th, 813th, and 818th, respectively. In rural districts, the total share of lower and lowest income groups reaches 55%. The socioeconomic level score of Bursa's 17 districts, which ranks 5th in the provincial ranking with 137 points, and the ratio of households according to socioeconomic level classification are summarized in the table below.
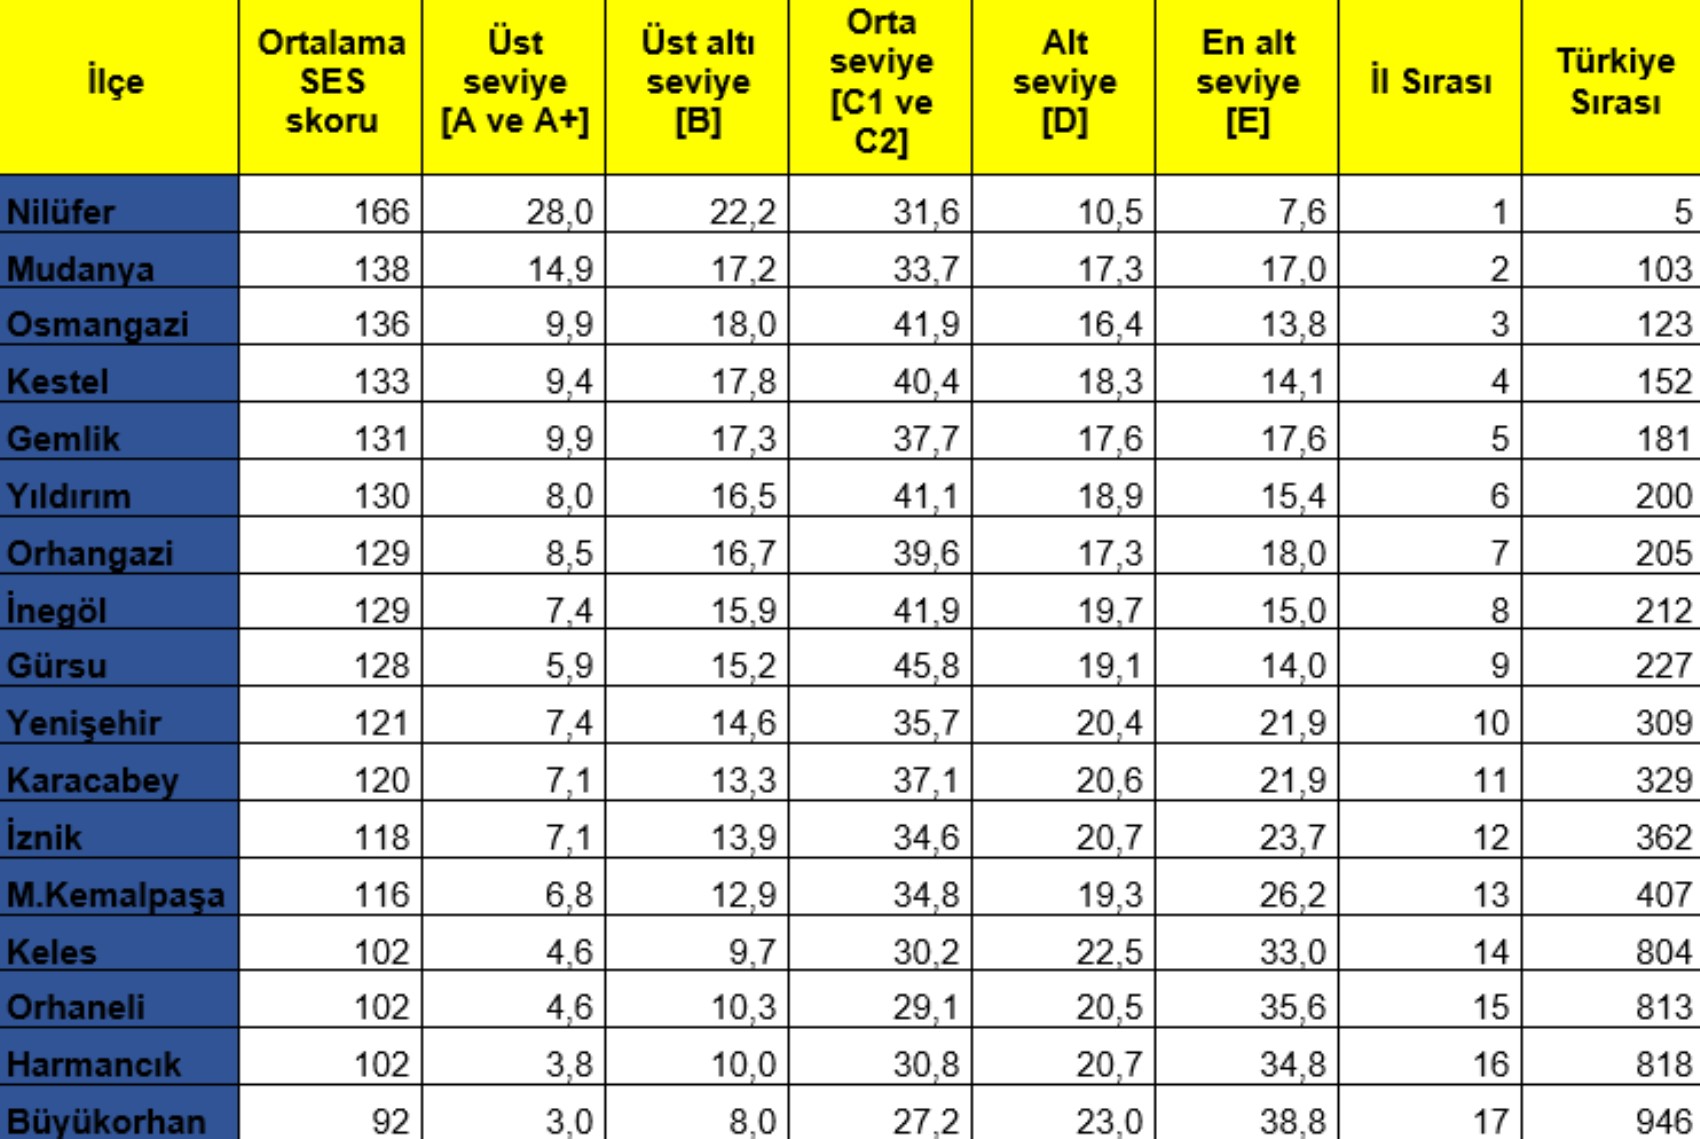
Bursa has a sharp socioeconomic divide between centers where industry and trade are strong and mountain districts that make a living from agriculture and animal husbandry. While prosperity in Nilüfer resembles that of metropolises, living standards in mountain districts are well below the Turkish average.
A TWO-FACED PICTURE IN ADANA: THE PROSPERITY OF ÇUKUROVA, THE POVERTY OF NORTHERN DISTRICTS
Adana's average SES score is 129, and there are more than 667 thousand households in the city. While 10.2% of households are in the top and upper groups, 37.6% are in the lower and lowest groups. In line with this data, Adana ranks 18th among provinces after Ankara, Istanbul, Kocaeli, Izmir, Bursa, Eskişehir, Tekirdağ, Antalya, Muğla, Sakarya, Batman, Bolu, Düzce, Rize, Trabzon, Bilecik, and Kayseri. The number of households in the top group is 4,643, and this figure corresponds to 0.7% of the total number of households. In this area, Adana was recorded as the 7th province with the most households in the top group after Istanbul, Ankara, Izmir, Bursa, Kocaeli, and Antalya. While the number of households in the upper group was 63,371, 102,267 households were classified in the upper-lower group, and 136,134 households in the upper-middle group. In contrast, it was observed that a large portion of the 361,511 households in Adana are in lower categories from a socioeconomic perspective. The distribution of these households was as follows: 109,317 households are in the lower-middle group, 137,452 households in the lower group, and 114,742 households in the lowest group.
The Çukurova district's average SES score is 159, and it ranks 17th among the districts with the highest scores in Turkey. It is also in the upper income group with a rate of 22.9% and in the middle income group with a rate of 32%, and has a very high appearance in terms of urbanization and education level. The Sarıçam district ranks 2nd in Adana and 162nd in Turkey with 133 points. The Seyhan district, with an average SES score of 126 and 241st place, stands out as a region where 36.8% of middle income groups and 21.2% of lower income groups are concentrated, and the need for social support is evident, while the Yüreğir district, with an average SES score of 118 and 375th place, is a region where 38.7% of middle income groups and 24.1% of lower income groups are concentrated, and the need for social support is evident. The Feke district ranks 805th with an average SES score of 102, the Karataş district ranks 678th with 107 points, the Saimbeyli district ranks 643rd with an average SES score of 108, and the Tufanbeyli district ranks 509th with an average SES score of 112. The socioeconomic level score of Adana's 15 districts, which ranks 18th in the provincial ranking with 129 points, and the ratio of households according to socioeconomic level classification are summarized in the table below.
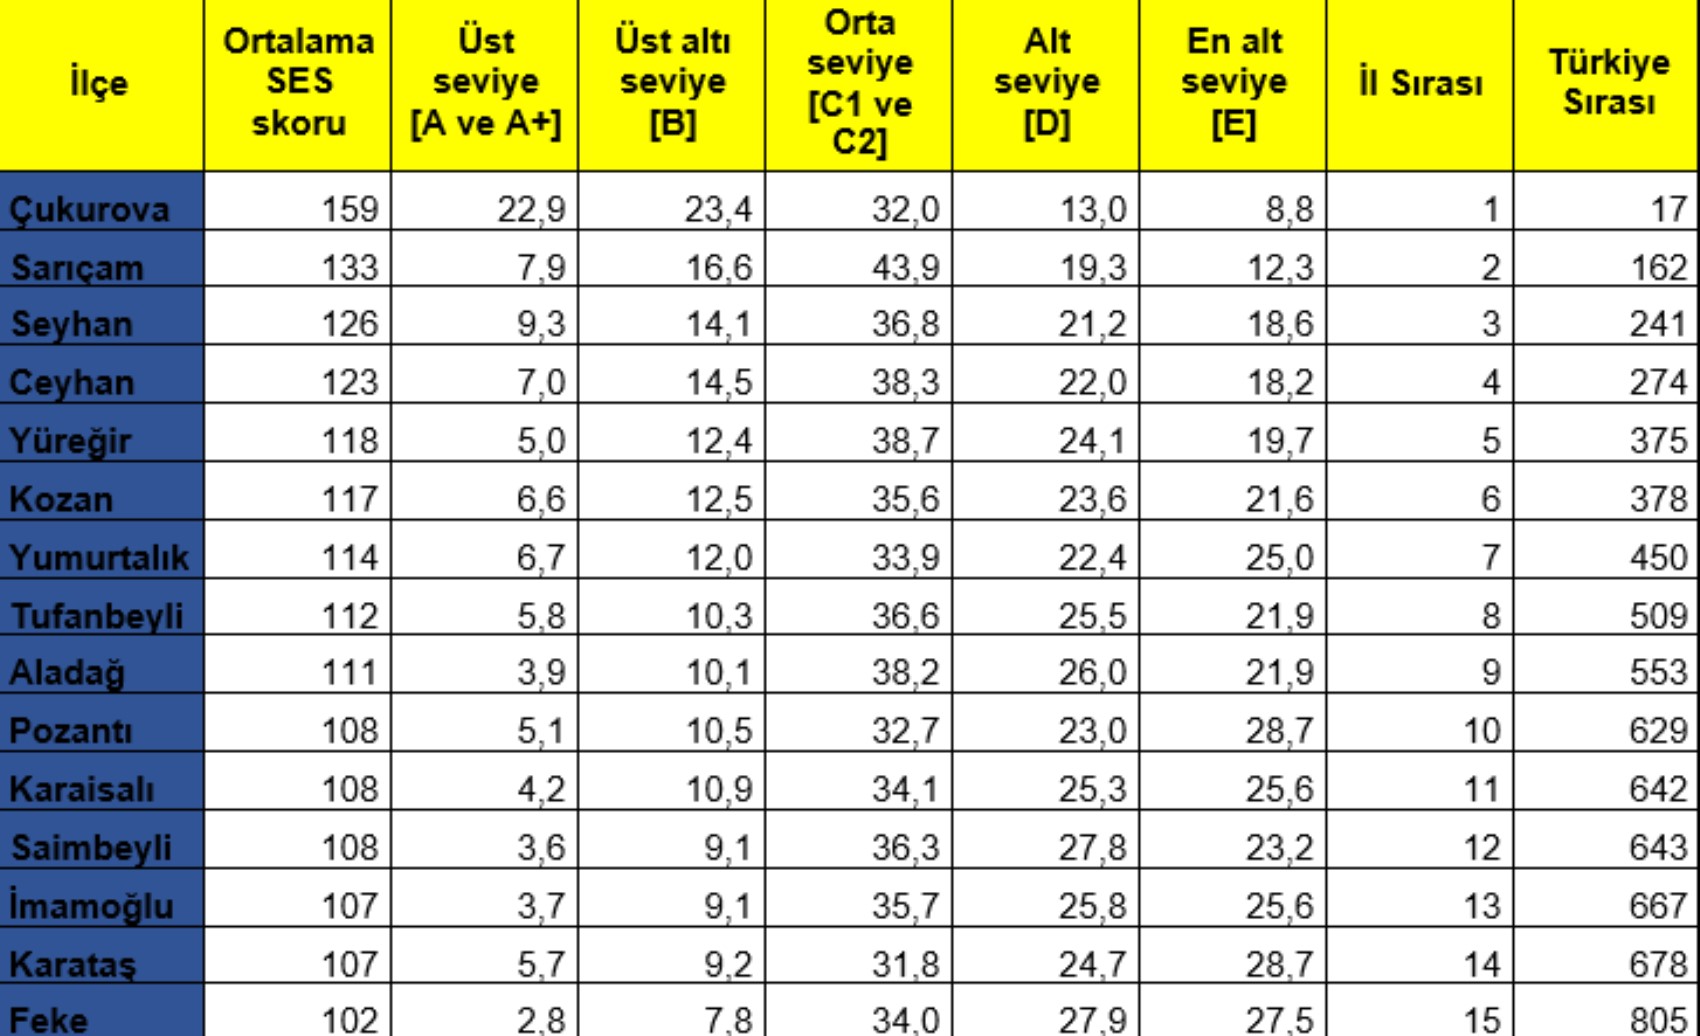
The difference between the prosperity of urban centers and the poverty of rural regions in Adana shows that social policies remain insufficient and that targeted measures are needed.
SEGE 2022 AND SES 2023: THE SAME MAP OF POTENTIAL AND ACTUAL SITUATION
While SEGE (Socio-Economic Development Index) 2022 measures the development potential of districts according to indicators of education, health, employment, infrastructure, and quality of life; SES 2023 reflects the current prosperity status based on the actual income, education, and occupation level of households.
Comparison Across Turkey
Districts that ranked at the top in SEGE 2022, such as Çankaya, Kadıköy, and Beşiktaş, are also in the upper income group in the SES 2023 data. Districts that ranked in the lower tiers in SEGE, such as Doğanşar, Felahiye, and Bayramören, are also seen at low income levels in the SES data. The three major cities exhibit a level of prosperity above the Turkish average in both SEGE and SES results.
Comparison in Bursa
According to SEGE 2022 data, while Nilüfer is among the top-tier developed districts, Keles and Büyükorhan are in the lower tiers. In the SES 2023 results, Nilüfer is in the A+ group, while Keles and Büyükorhan are in the D–E group. This situation reveals that districts with high development potential are also strong in actual prosperity levels, while the potential of disadvantaged districts also remains low.
Comparison in Adana
According to SEGE 2022 data, while Çukurova and Seyhan are in the upper tiers, Feke, Saimbeyli, and Tufanbeyli are in the bottom tiers. In the SES 2023 results, the same districts are concentrated in the upper and lower income groups. Both data sets confirm that the socioeconomic divide between the urban center and rural regions is permanent and structural.
WHAT SHOULD BE DONE?
Turkey's socioeconomic map reveals a picture that must now be managed not just with general strategies, but with district-based targets. Therefore;
Development programs specific to districts should be designed: Instead of general incentives, special support should be given to disadvantaged districts according to SES data. Projects that will increase agricultural value-added in rural regions should be prioritized.
Education and employment should be handled together: Vocational training and job-guaranteed education centers should be established in districts in low SES groups. The migration of the young population to large cities can be slowed down in this way.
Local government policies should be directed toward targets: Municipalities should plan social assistance and development projects according to the SES map. Resources should be transferred to neighborhoods and districts where lower groups are concentrated.
Industrial and service investments should be balanced: In industrial cities like Bursa, rural districts cannot get a share of the industry. Small-scale production centers and cooperatives should be supported for these regions. In Adana, investments that will modernize agriculture and animal husbandry in the northern districts should be prioritized.
SEGE and SES should be used together: When SEGE, which shows potential, and SES, which measures the actual situation, are read together, both today's problems and future risks are seen more clearly. These two data sets can enable central government and local governments to speak the same language.
CONCLUSION: DIFFERENT WORLDS IN THE SAME CITIES IN TURKEY
Turkey's SES 2023 report reveals the naked truth behind the rhetoric of growth and prosperity: while prosperity is concentrated in the hands of a small minority in a few centers, millions of households are struggling to make ends meet. The sharp contrast created by Nilüfer and Büyükorhan in Bursa, and Çukurova and Feke in Adana, clearly reveals that the divide is not only economic but also a matter of social justice and equal opportunity. This picture serves as a critical warning for Turkey's future: unless development policies are targeted on a district basis, it will not be possible for prosperity to spread in a balanced way across the country.
The data in the report proves that inequality is deepening not only between provinces but also between districts of the same province. The difference between Nilüfer and Büyükorhan, and Çukurova and Feke, reveals the reality of "two separate Turkeys" within a single country. The development map revealed by SEGE 2022 also overlaps with SES 2023: while districts with high potential increase their prosperity, disadvantaged regions fall further behind in terms of both development and income.
This picture offers a clear roadmap for policymakers. Social support and investments should be targeted specifically at districts; education and employment programs should be prioritized, especially in disadvantaged regions. Turkey's economic growth should spread in a balanced way not only in metropolises but across the entire geography. Otherwise, a structure where prosperity is concentrated in certain centers and the remaining regions carry the risk of permanent poverty will be inevitable.
Although Bursa and Adana are among the country's strong economic centers, the socioeconomic differences between districts are remarkable. The data shows that while increasing the competitiveness of developed districts, special support mechanisms are mandatory for underdeveloped regions. Selective policies, infrastructure investments, and projects aimed at qualified human resources are of critical importance to eliminate regional development differences.
When these strategies are implemented, imbalances between regions, provinces, and districts will decrease; a more inclusive, sustainable, and balanced development model will be possible.
Most Read
Striking picture for Özgür Özel's 'New Party'

The PKK opening and Özgür Özel’s path!..

How did the newspapers view Özgür Özel's farewell to the CHP?

He killed his wife by slitting her throat: Their children witnessed the moments

What did the CHP do?

Özel’s new party move in the world press

Fire at TUSAŞ engine factory in Eskişehir under control

The New CHP, against CEHAPE

From self-efficacy to despair

Kılıçdaroğlu's first message on Özgür Özel's new party announcement