Striking result from Metropoll Research survey: Which party will voters who left the AKP vote for?
In a survey conducted between July 12-16, 2024, Metropoll Research investigated which party the votes that have moved away from the AKP are going to.
12punto
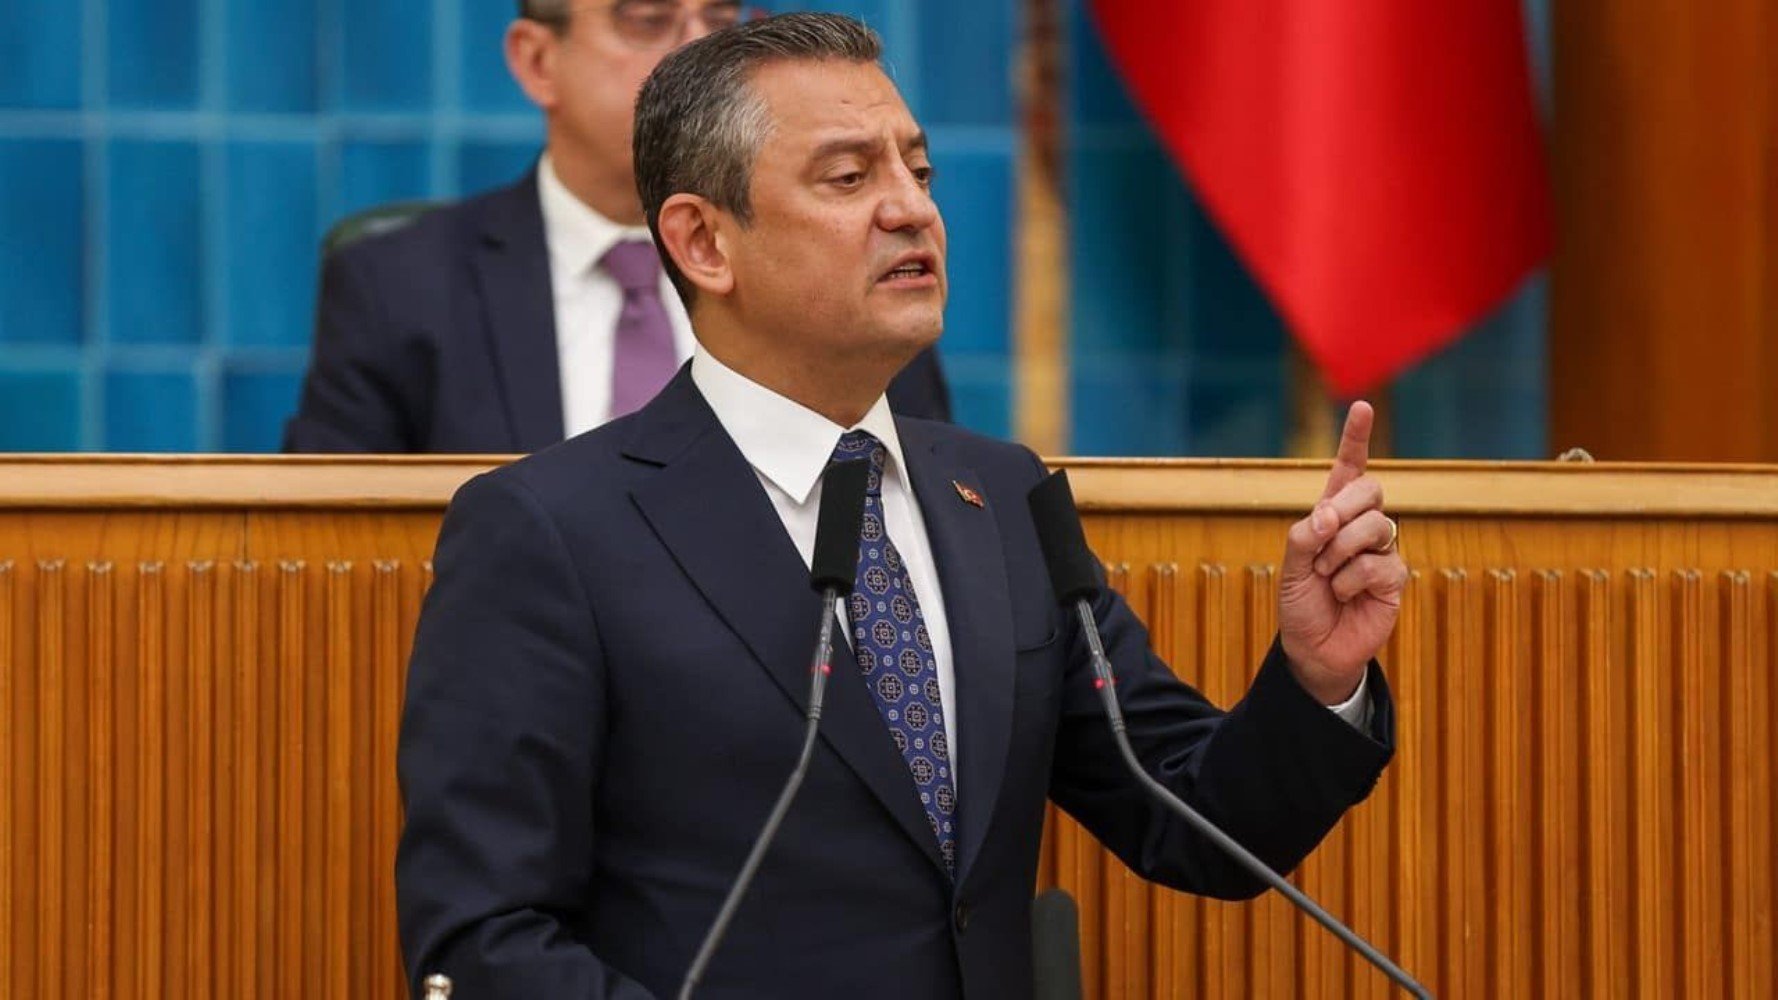
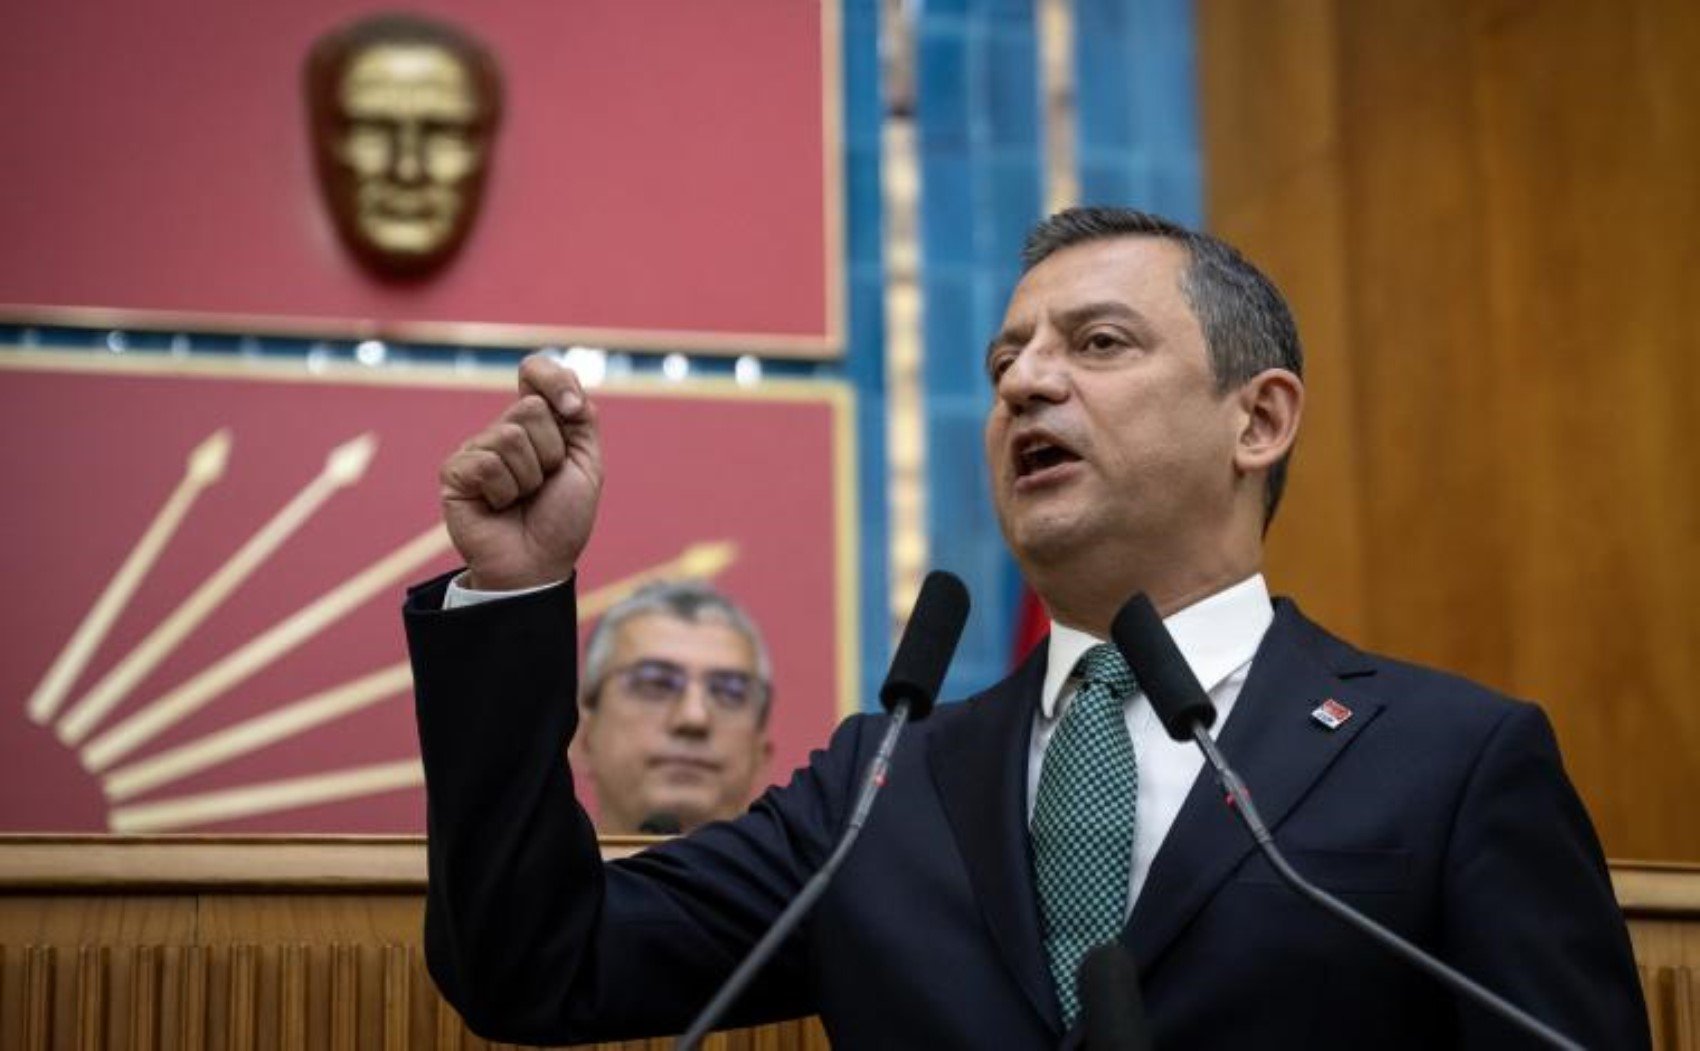
CHP Chairman Özgür Özel, who emerged victorious from the March 31 local elections, continues to reiterate his calls for early elections in recent days.
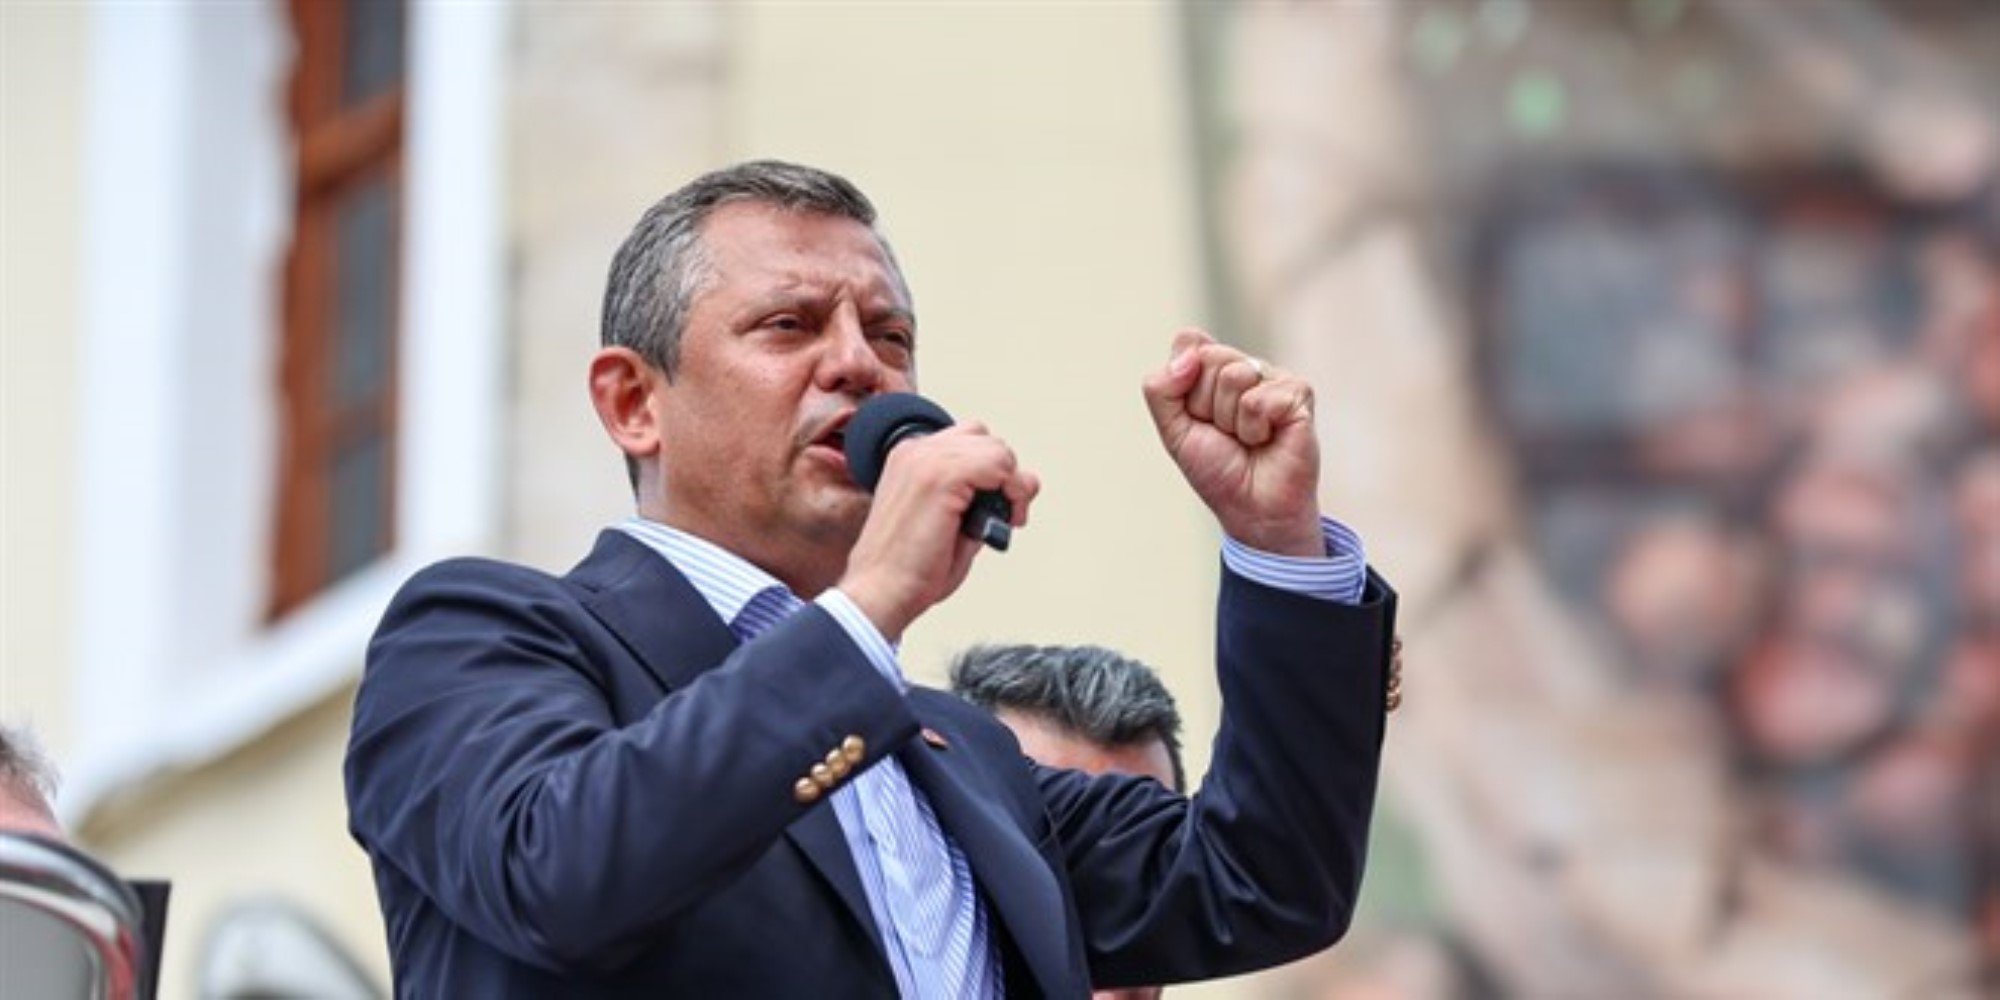
Criticizing the AKP government over the economic crisis, the minimum wage, and pensions, Özel says "If there is no livelihood, there is an election" at the rallies he organizes.

As discussions regarding early elections continue, Metropoll Research has conducted a noteworthy study.
The head of Metropoll Research shared the results of a survey reflecting the vote shares of political parties, which was conducted with a total of 1,699 people in 28 provinces between July 12 and 16.
The research reveals the current preferences of voters who cast their ballots for the AKP in the May 14 elections.
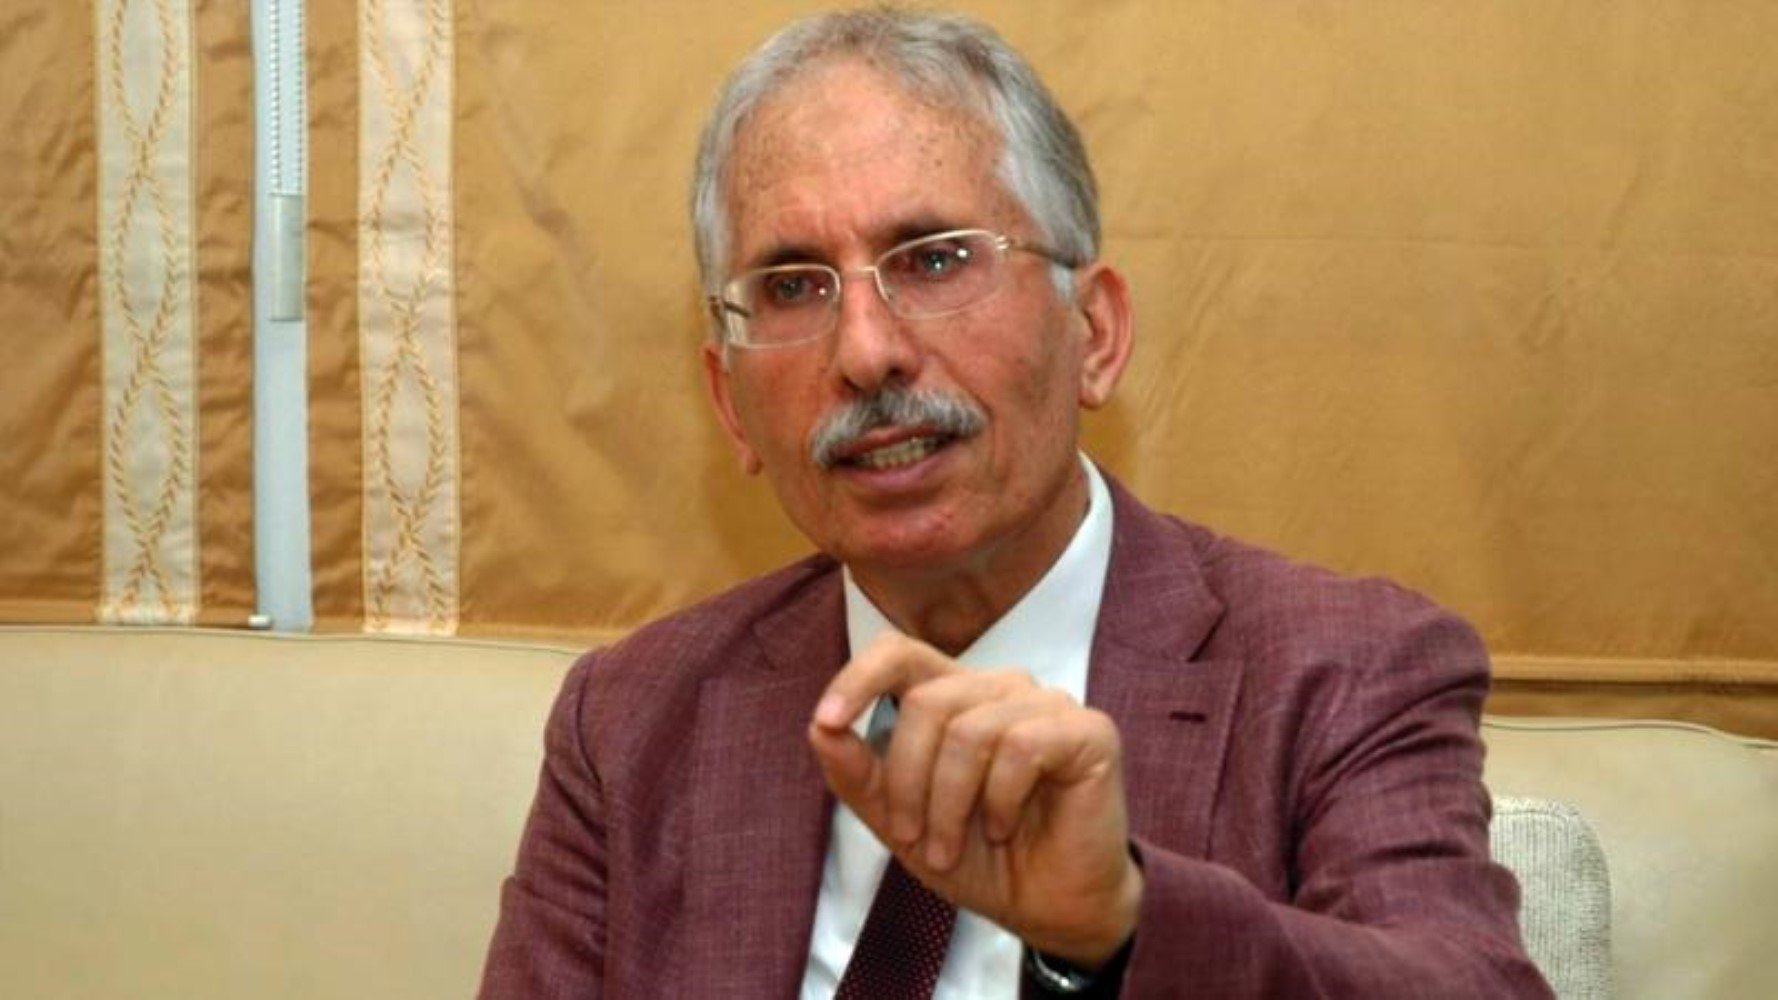
“APPROXIMATELY 17 PERCENTAGE POINTS OF AKP VOTERS HAVE MOVED AWAY FROM THEIR PARTY”
In a post on his social media account X, Sencar drew attention to the current party preferences of voters who cast their ballots for the AKP on May 14, 2023, stating, “Approximately 17 percentage points of AKP voters appear to have moved away from their party. Only 2.3 points of this have shifted to the CHP, while 11 points have shifted to the undecided category.”

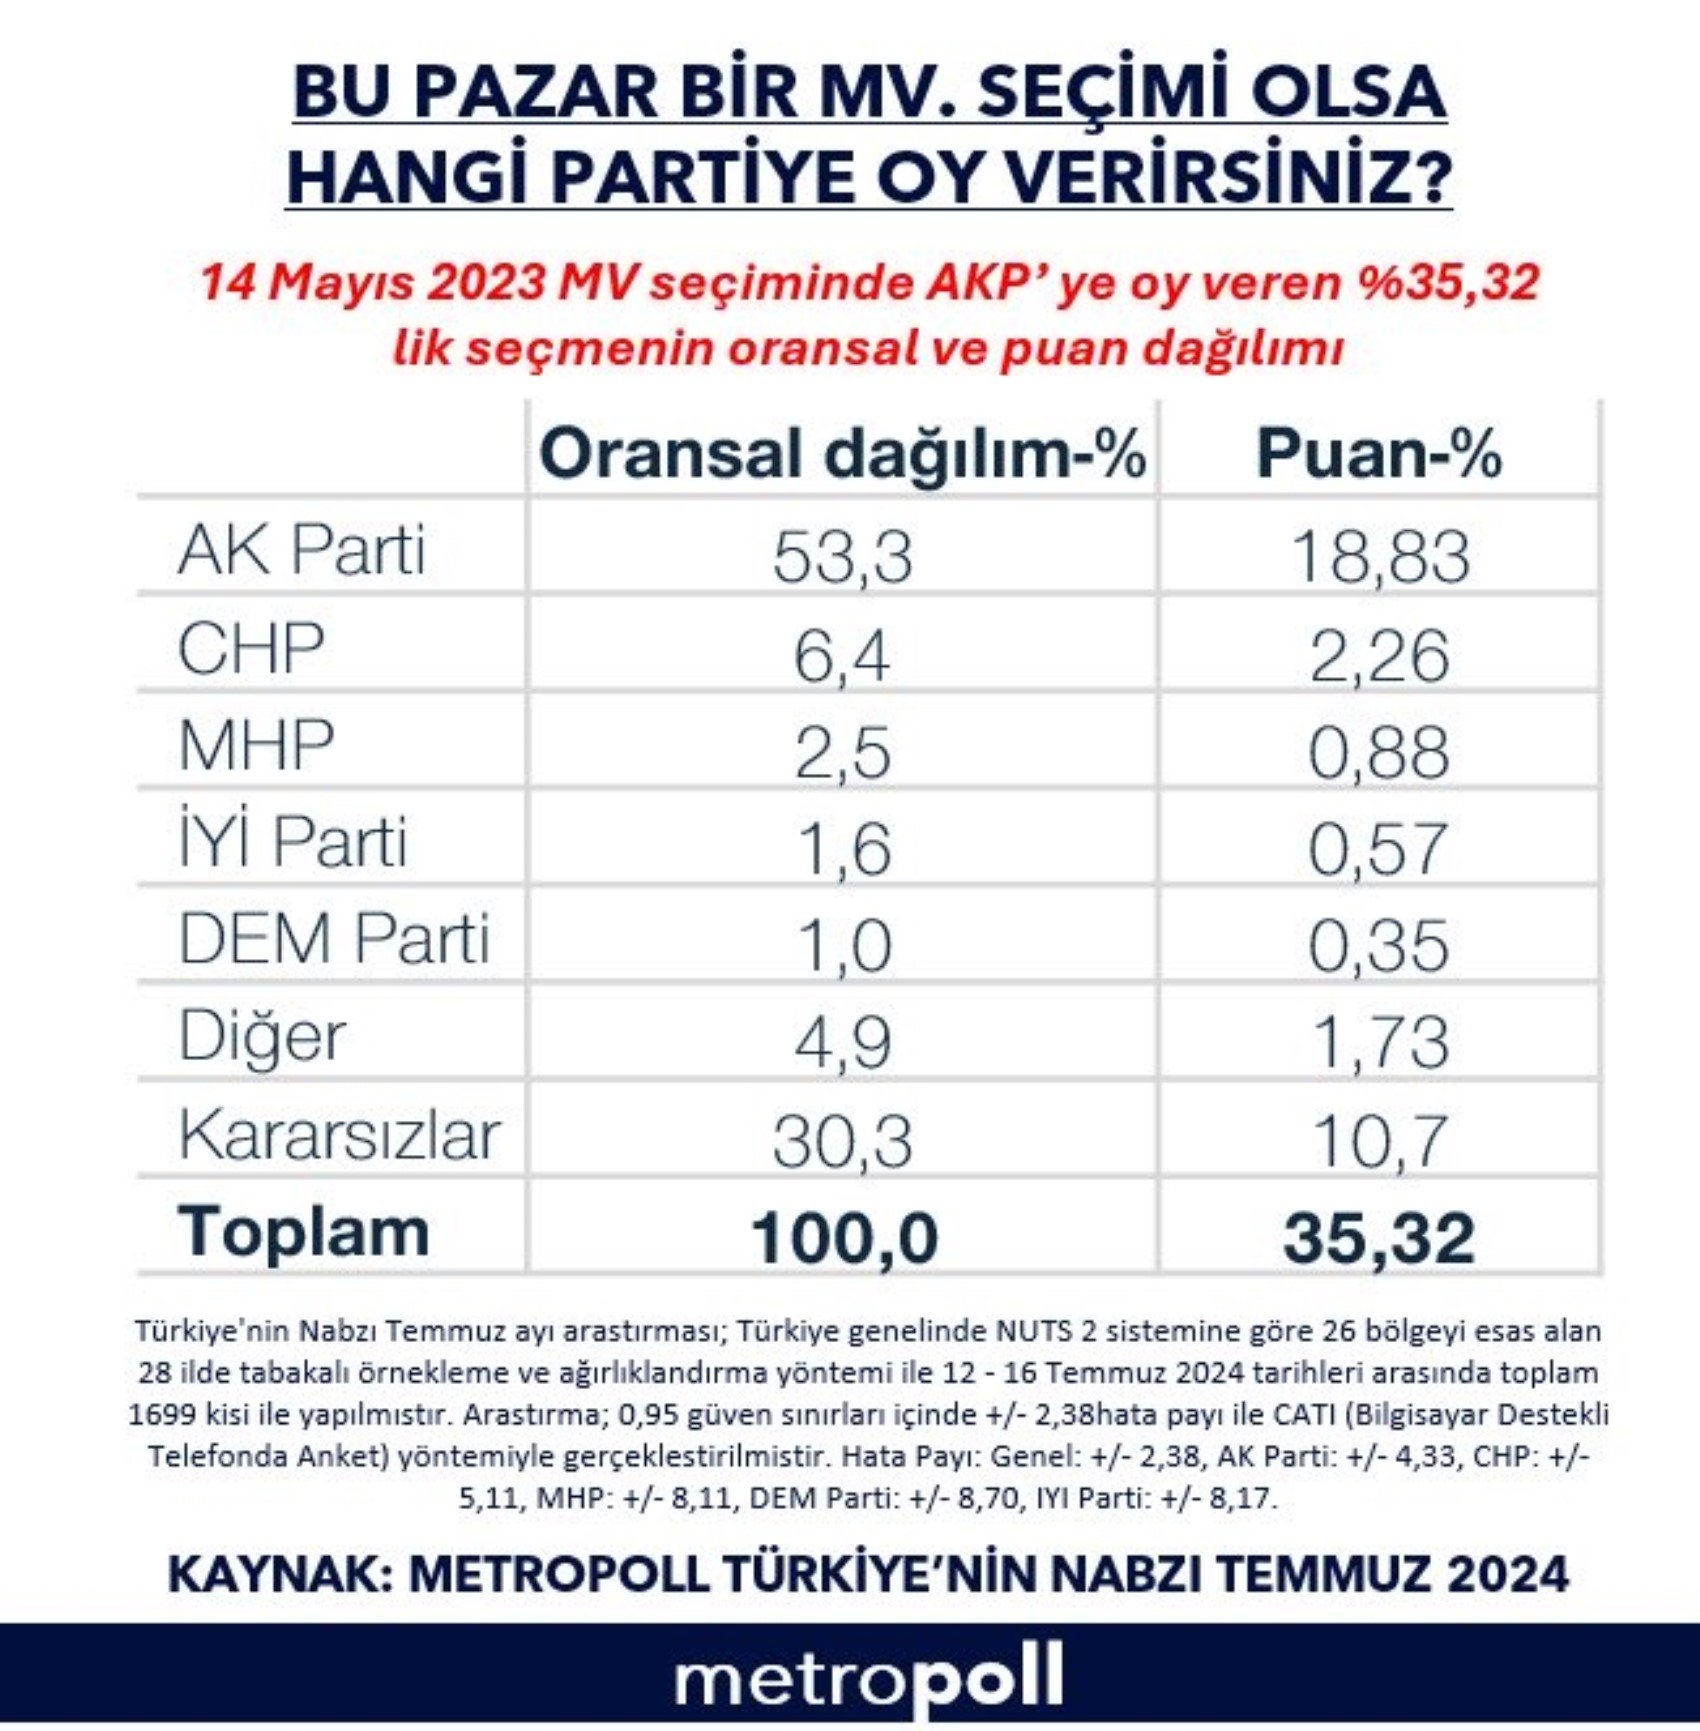
In the survey, participants were asked, "If a parliamentary election were held this Sunday, which party would you vote for?" Sencar shared the proportional and point distribution of the 35.32 percent of voters who cast their ballots for the AKP in the May 14, 2023, parliamentary elections.
Here are the survey results:
AKP: Proportional distribution 53.3 percent – Points 18.33 percent
CHP: Proportional distribution 6.4 percent – Points 2.26 percent
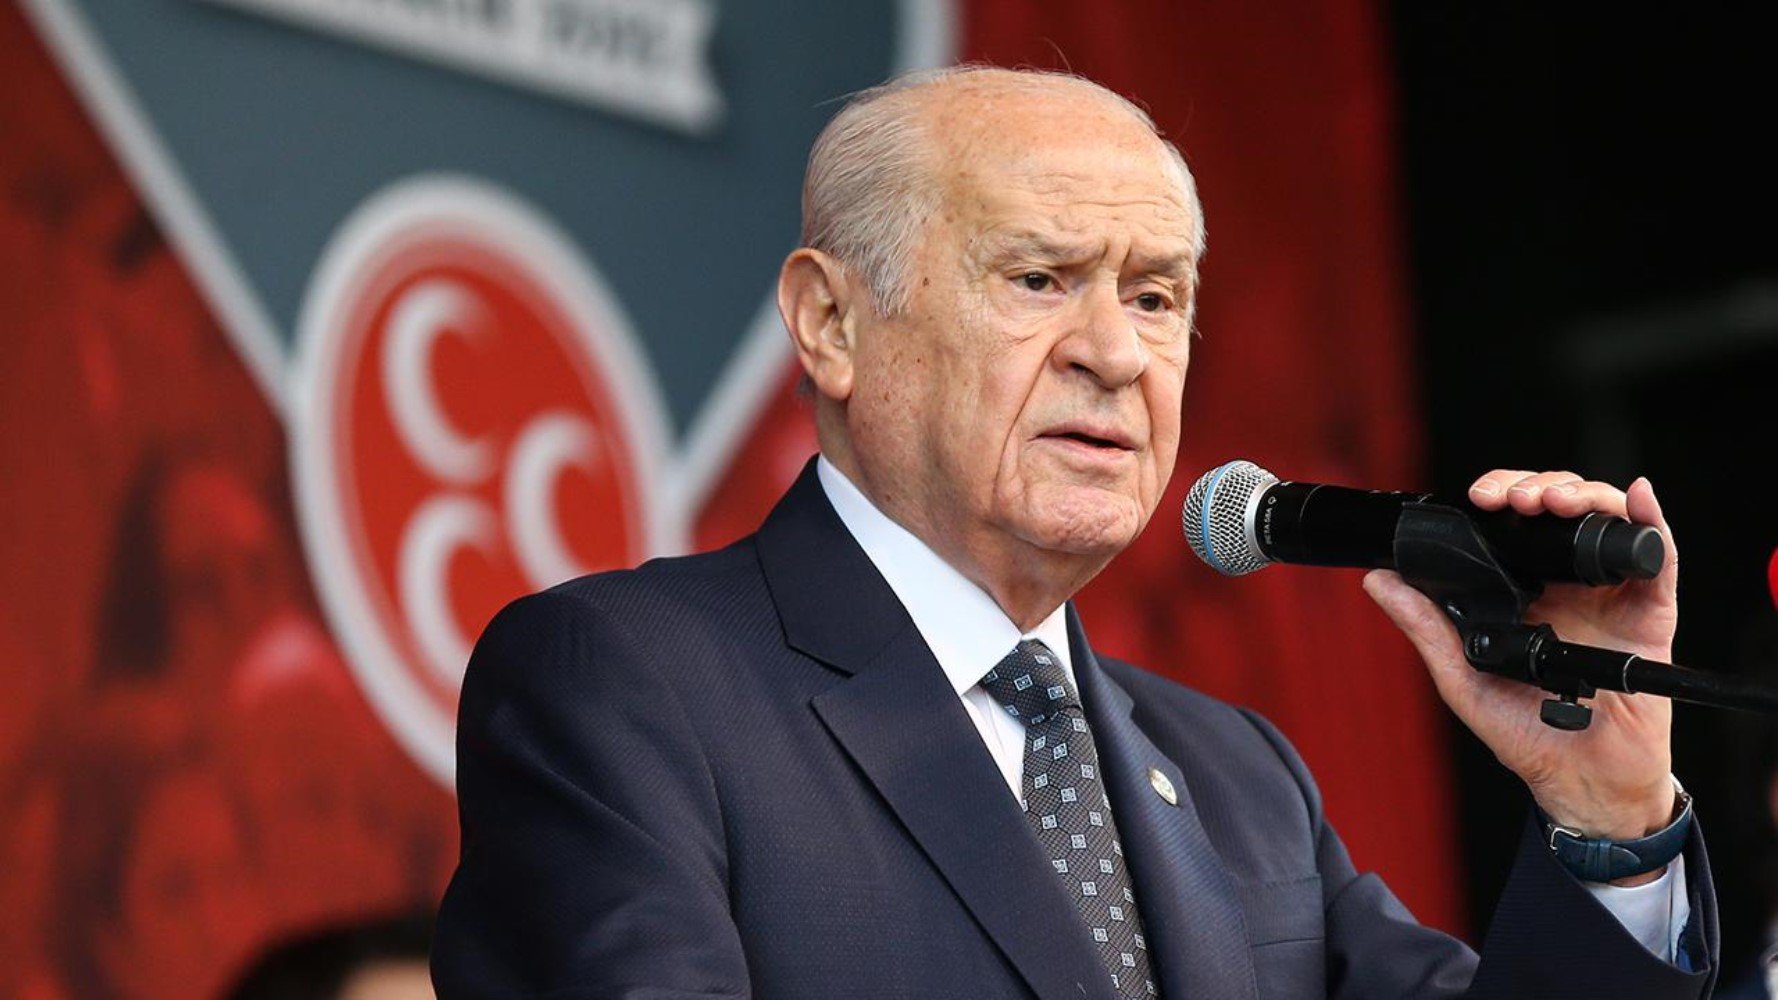
MHP: Proportional distribution 2.5 percent – Points 0.88 percent
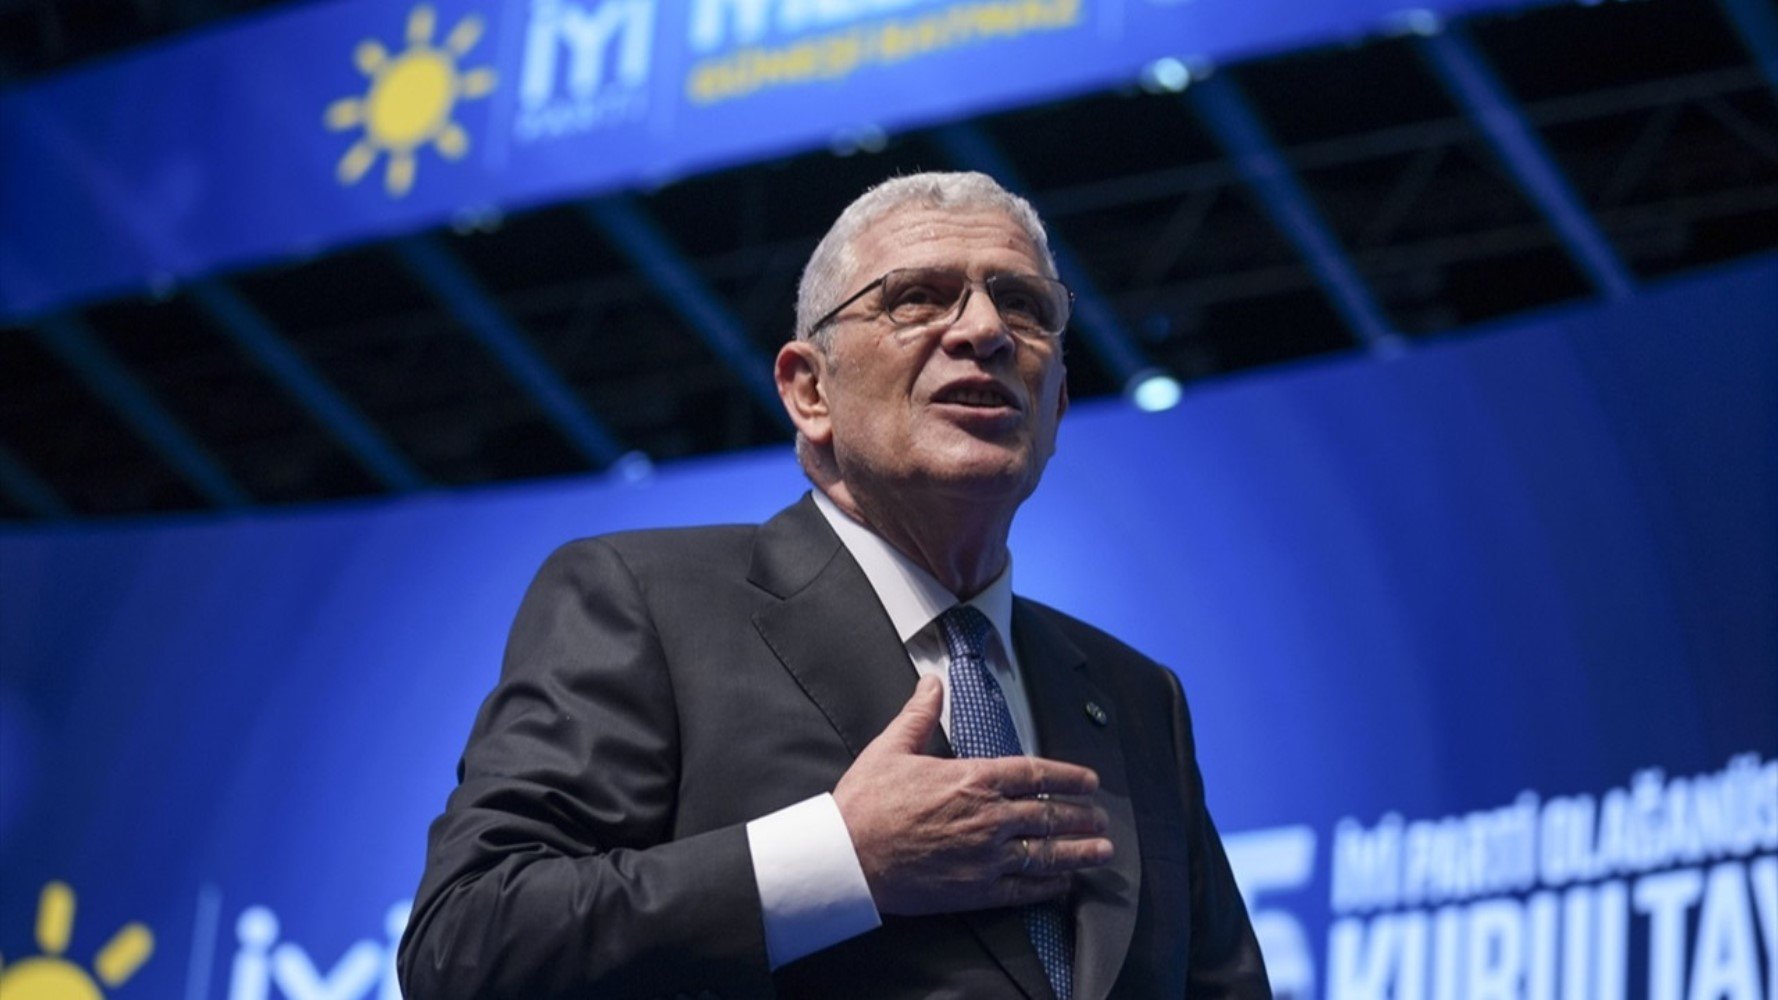
İYİ Party: Proportional distribution 1.6 percent – Points 0.57 percent
DEM Party: Proportional distribution 1 percent – Score 0.35 percent
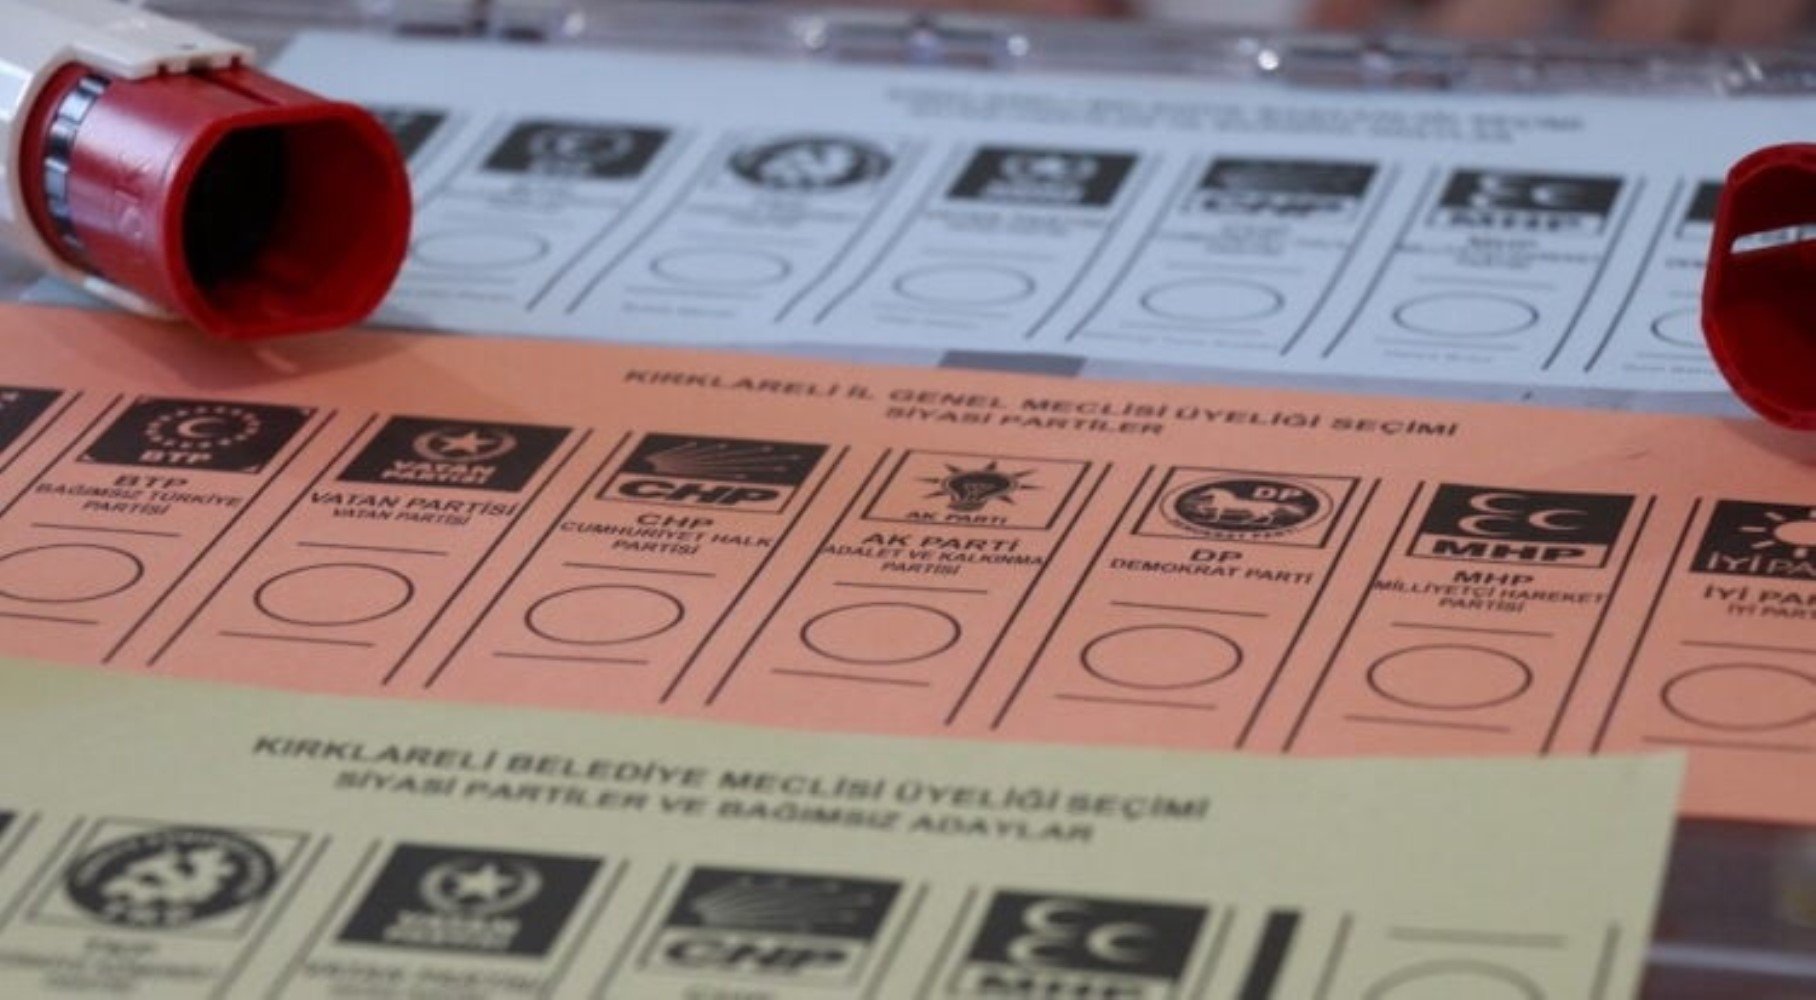
Other: Proportional distribution 4.9 percent – Points 1.73 percent
Undecided voters: Proportional distribution 30.3 percent – Points 10.7 percent
Here are the results: