


Growth exists, fair distribution does not: Income is rising, inequality is deepening



The Turkish economy is growing on paper. Average incomes are rising rapidly, the total pie is expanding, and official indicators point to a "positive" picture. However, the question of whose pocket this growth enters and whose life it truly touches inevitably comes to the fore at this very point. Because while the numbers are rising, the burden of daily life is not easing; the increase in prosperity is not translating into a tangible reality for broad segments of society.
TÜİK's 2025 Income Distribution Statistics reveal this contradiction with full clarity. While the top 20 percent with the highest income receive 48 percent of the total income, the share of the lowest 20 percent remains at only 6.4 percent. In other words, nearly half of the income produced in the country is concentrated in one-fifth of the population. This picture shows that the income gap is not narrowing; on the contrary, it is becoming permanent, purchasing power is lagging behind the statistics, and regional differences and vulnerabilities based on household structure are deepening.
Therefore, the issue is no longer the question of "is there growth?"; it is about who the growth is for, to what extent it turns into prosperity, and how it strains social fault lines. TÜİK's 2025 data transforms the emerging landscape from being merely an economic snapshot; it turns it into a powerful warning that makes social tension, class stratification, and areas of vulnerability visible.
Although the rapid increase in average incomes may seem like a positive development at first glance, it is impossible to speak of economic success without answering the question of who benefits from this increase and to what extent. Because growth only gains meaning to the extent that it is shared fairly. Otherwise, rising numbers turn into a statistical curtain covering up shrinking lives.
In this article, based on TÜİK's 2025 income distribution data, I have attempted to analyze in great detail why the growing economy cannot produce fair prosperity, while addressing income inequality in Turkey in a multidimensional way in light of indicators such as the Gini coefficient and the P80/P20 ratio, as well as comparisons with OECD countries and differences based on sectors, provinces, and regions.
INCOME IS CONCENTRATED AT THE TOP, LIFE IS SQUEEZED AT THE BOTTOM: Half of the Income is in the Top Income Group
Long-term data on income distribution offers a very clear and permanent picture of who growth in Turkey is for. As can be seen in the table below; when looking at the 2016–2025 period, it is observed that the share of the top 20 percent with the highest income in total income has consistently hovered in the 46–48 percent band. As of 2025, this rate has reached 48 percent. In other words, nearly half of the total income created in the country goes to only one-fifth of the population.
In contrast, the share of the bottom 20 percent in the lowest income group has remained stuck in the 5.9 to 6.4 percent range during the same period. In 2025, this rate is calculated as 6.4 percent. The fact that there has been no significant improvement in the share of the lower income group in the approximately ten-year period that has passed shows that inequality has acquired a structural, not temporary, character. The size of the pie is increasing in the growing economy, but the slices taken from the pie are not changing.
While the shares of the second and third 20 percent income groups also largely remain stagnant, the fact that the share of the fourth 20 percent group is stuck in the 20–21 percent band suggests that the middle class is also trapped in a narrow area in terms of the share it receives from income. This structure reveals that the problem in income distribution is not just about the gap between the very bottom and the very top; it shows that a balance has formed where broad segments of society receive a limited share of growth.
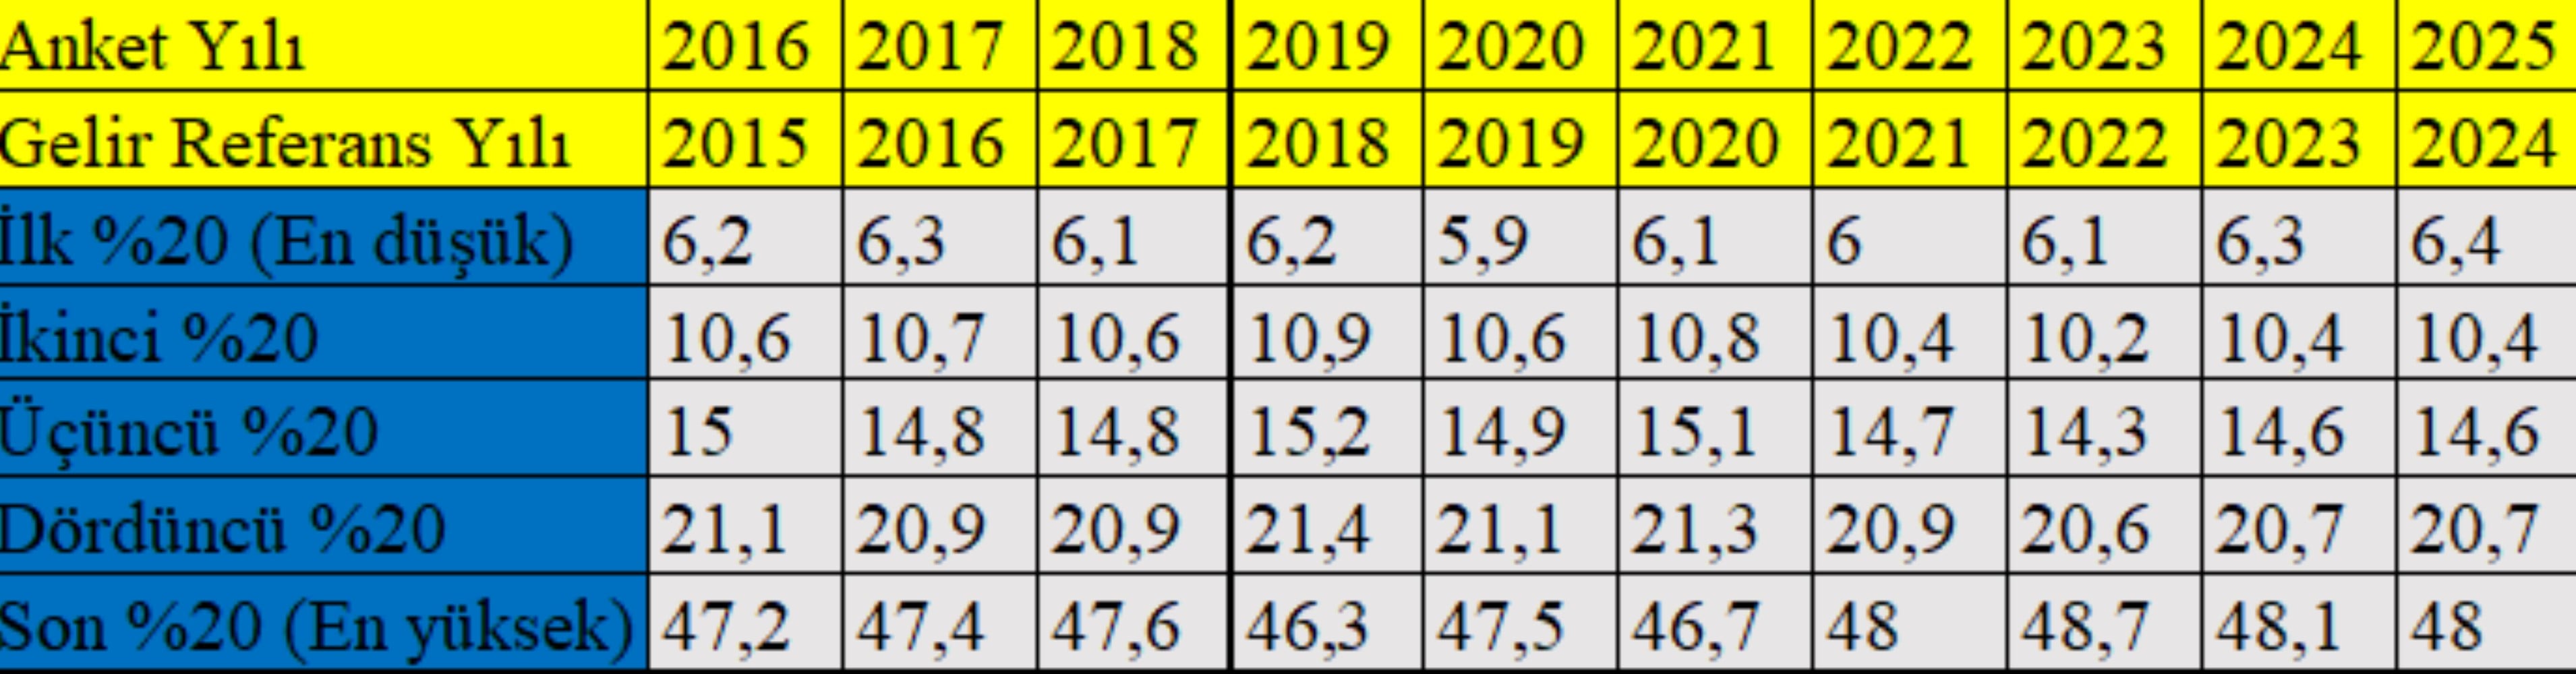
Although there have been technically small fluctuations over the years, the gap is not closing. A balance where the upper income group maintains its share and the lower income group is squeezed at low levels is becoming permanent. This situation clearly shows that economic growth is not spreading to the social base; income growth is concentrated primarily in segments that are already in an advantageous position.
The concentration of income at the top in this way is not just a matter of statistics; it creates a problem area that limits social mobility, weakens equality of opportunity, and makes intergenerational transitions difficult. The fact that the share of the bottom income groups in the total pie has not changed for many years suggests that poverty and vulnerability have become a permanent structure, not a temporary periodic problem.
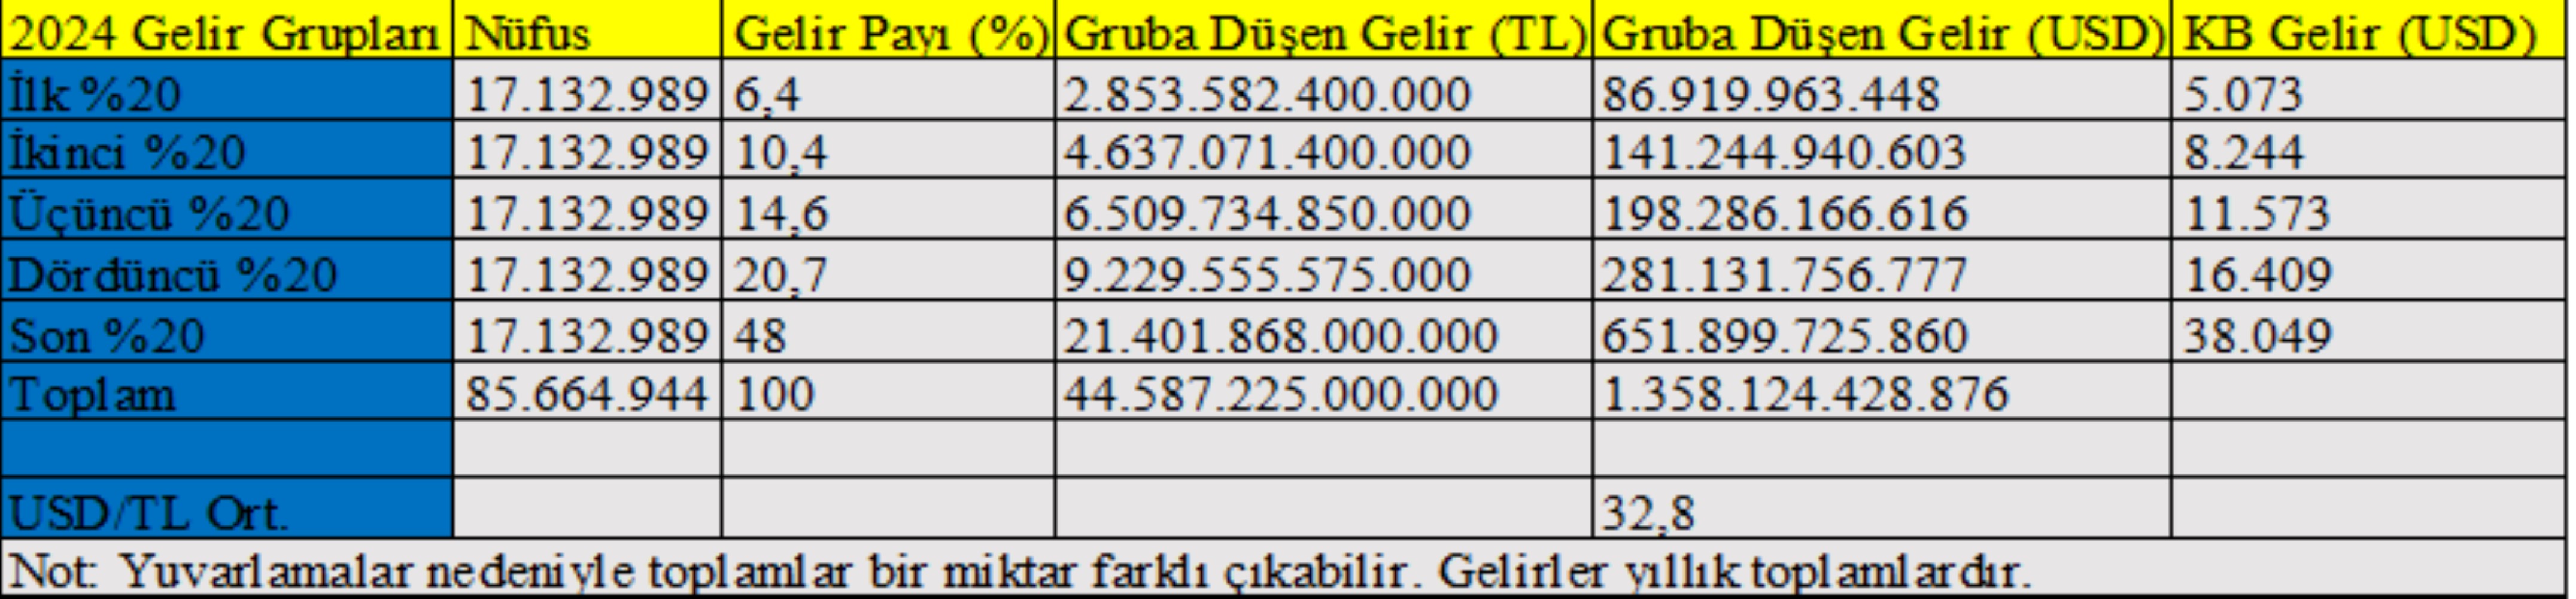
This picture also makes it necessary to question the assumption that growth automatically produces prosperity. Furthermore, as can be seen in the table below, which we created based on the table above, taking into account GDP data and population; there is growth in Turkey; however, this growth exhibits a structure that concentrates at the top and leaks downwards in a limited way when viewed in terms of income distribution. Ultimately, growing numbers do not mean a safer and more predictable life for broad segments of society.
STRUCTURAL RIGIDITY IN INCOME DISTRIBUTION: Inequality is Locked Even as Gini Seems to Fall
Although indicators regarding income distribution show signs of improvement in the short term, the long-term trend shows that inequality in Turkey maintains its structurally high level. Looking at the 2016–2025 period, it is seen that income injustice fluctuates from time to time, but never permanently declines in any period. The numbers change places, but the picture does not change.
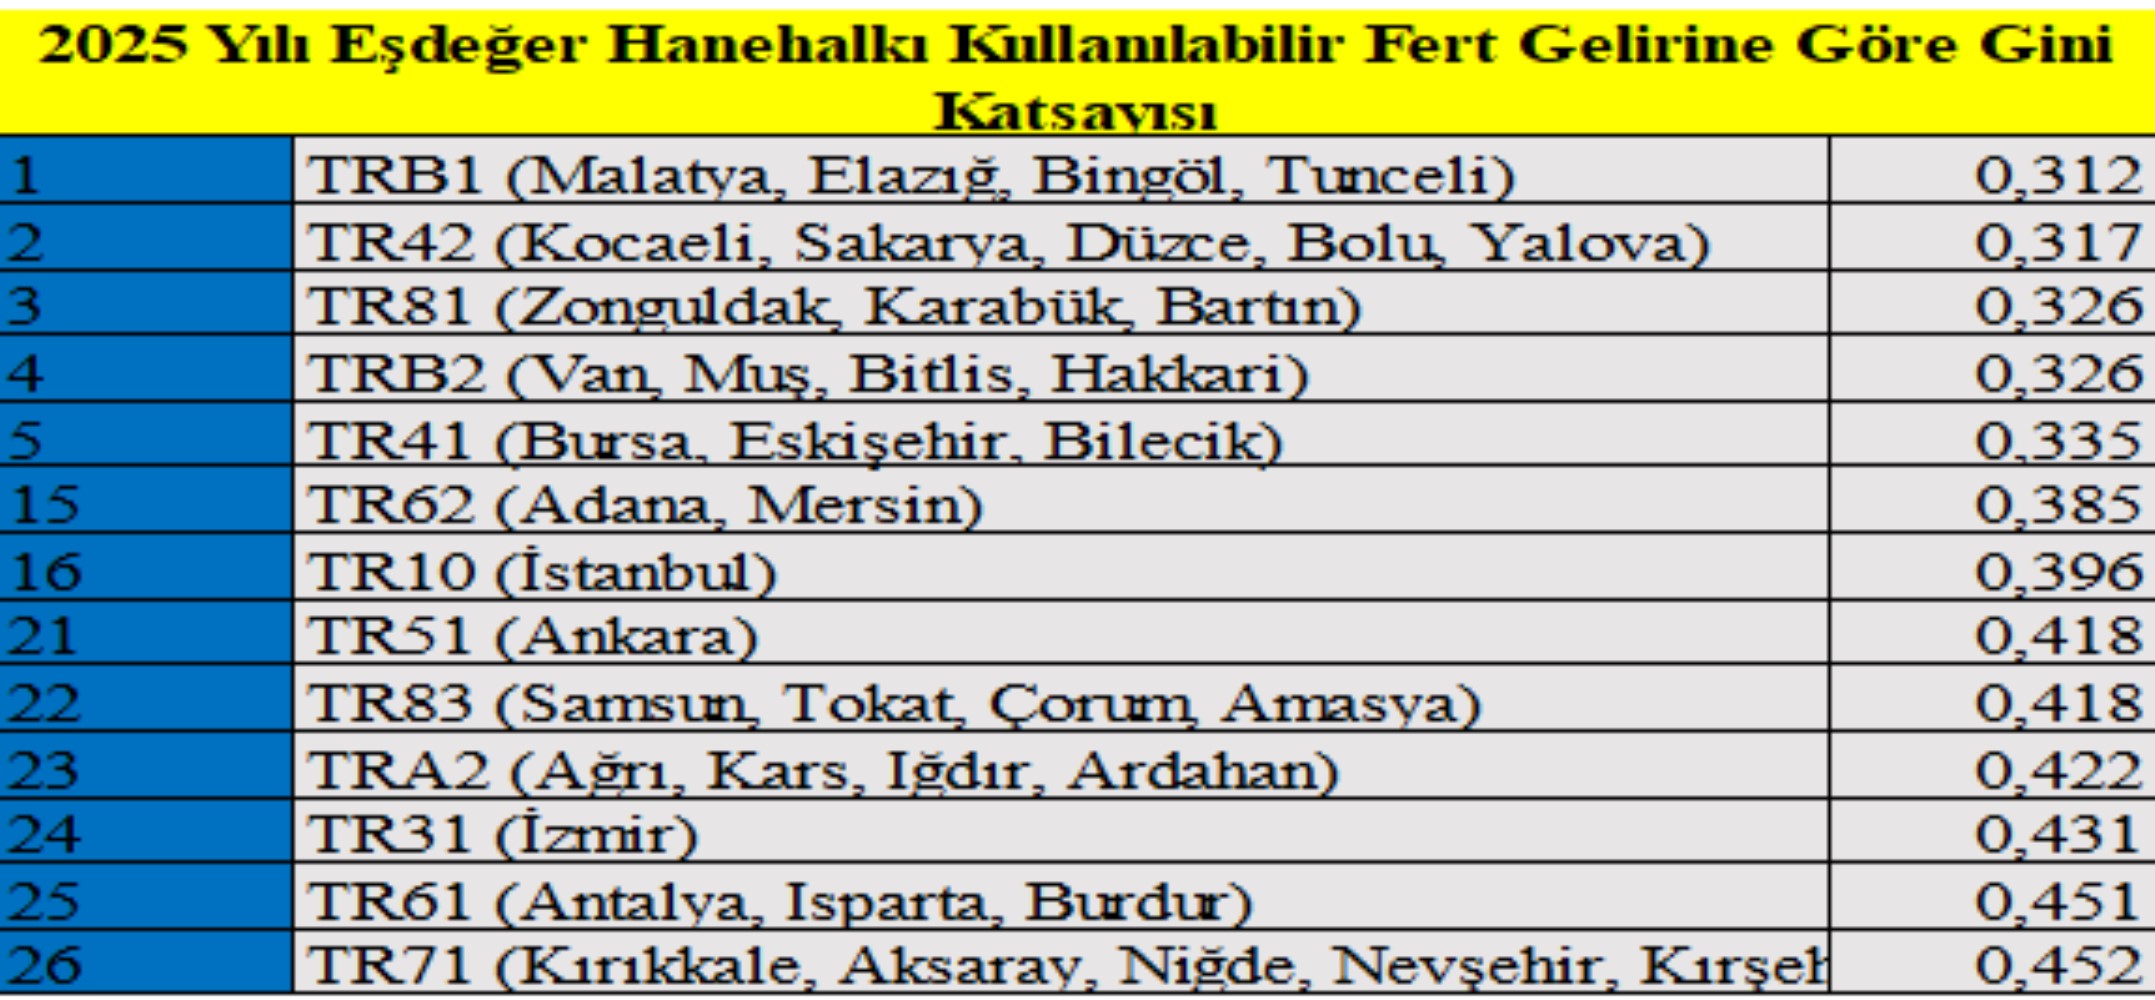
As can be seen in the table below; the P80/P20 ratio, which shows the ratio of the top 20 percent of society with the highest income to the bottom 20 percent with the lowest income, was 7.5 in 2025. Although there is a limited decline compared to the previous year, this ratio still reveals how wide the distance is between the top and bottom income groups. Indeed, the fact that this indicator has hovered in the 7.4–8.0 band for nearly the last ten years shows that the income gap has become a permanent feature, not an exceptional one. Similarly, the P90/P10 ratio, which expresses the ratio of the richest 10 percent to the poorest 10 percent, is at 12.9 in 2025 (in the 13-15 band over the last 10 years). This points not just to a difference between the top and the bottom, but to the existence of almost different economic worlds.

The Gini coefficient tells a similar story. As of 2025, the Gini coefficient is calculated as 0.410. Although there is a limited decline compared to the previous year, this level shows that Turkey is still among the countries with high income inequality. Moreover, the fact that the Gini coefficient has been stuck in the 0.395–0.420 range since 2016 indicates that improvements are temporary, while the problem is permanent.
The more striking picture emerges when social transfers are excluded. The rise of the Gini coefficient to 0.473 in 2025, excluding social transfers, clearly reveals that market incomes produce a highly unjust structure on their own. In other words, the main source of the deterioration in income distribution is market mechanisms; the transfers made by the state can only soften this deterioration to a limited extent.
The redistribution capacity of the tax and social security system can also be read through these indicators. The fact that the Gini coefficient calculated on gross income remained at 0.422 in 2024 and 2025 reveals the high level of inequality in the pre-tax income structure and that this structure has not shown a meaningful improvement over time. Although social transfers have an inequality-reducing effect, this effect is not strong enough to transform the structure; it functions more as a buffer that temporarily balances vulnerability.
When all these indicators are evaluated together, the picture that emerges is clear: limited declines in the Gini coefficient and small improvements in ratios do not indicate that income injustice is being solved, but that it is being normalized. Inequality is not the result of a temporary crisis; it continues to exist as a structural problem fed by the growth model, wage structure, tax system, educational opportunities, regional differences, and social policy preferences.
For this reason, policies focused solely on growth are not enough to achieve a permanent improvement in income distribution. Without a stronger, more inclusive, and justice-centered understanding of redistribution, every improvement in the numbers cannot go beyond creating a short-term statistical effect that covers up inequality.
NOMINAL PROSPERITY, REAL IMPOVERISHMENT: Rising Income, Eroding Purchasing Power
Household incomes in Turkey have been increasing at a remarkable speed over the last decade, especially in the last three years, as can be seen in the tables below. According to TÜİK data, while the annual average household disposable income was 41 thousand 399 TL in 2016, it has risen to 662 thousand 414 TL as of 2025. When viewed on paper, this increase points to a strong income leap. Especially after 2022, the nominal increase in incomes has accelerated; the high growth rates announced in 2023, 2024, and 2025 create an image of a prosperity explosion in the statistics.
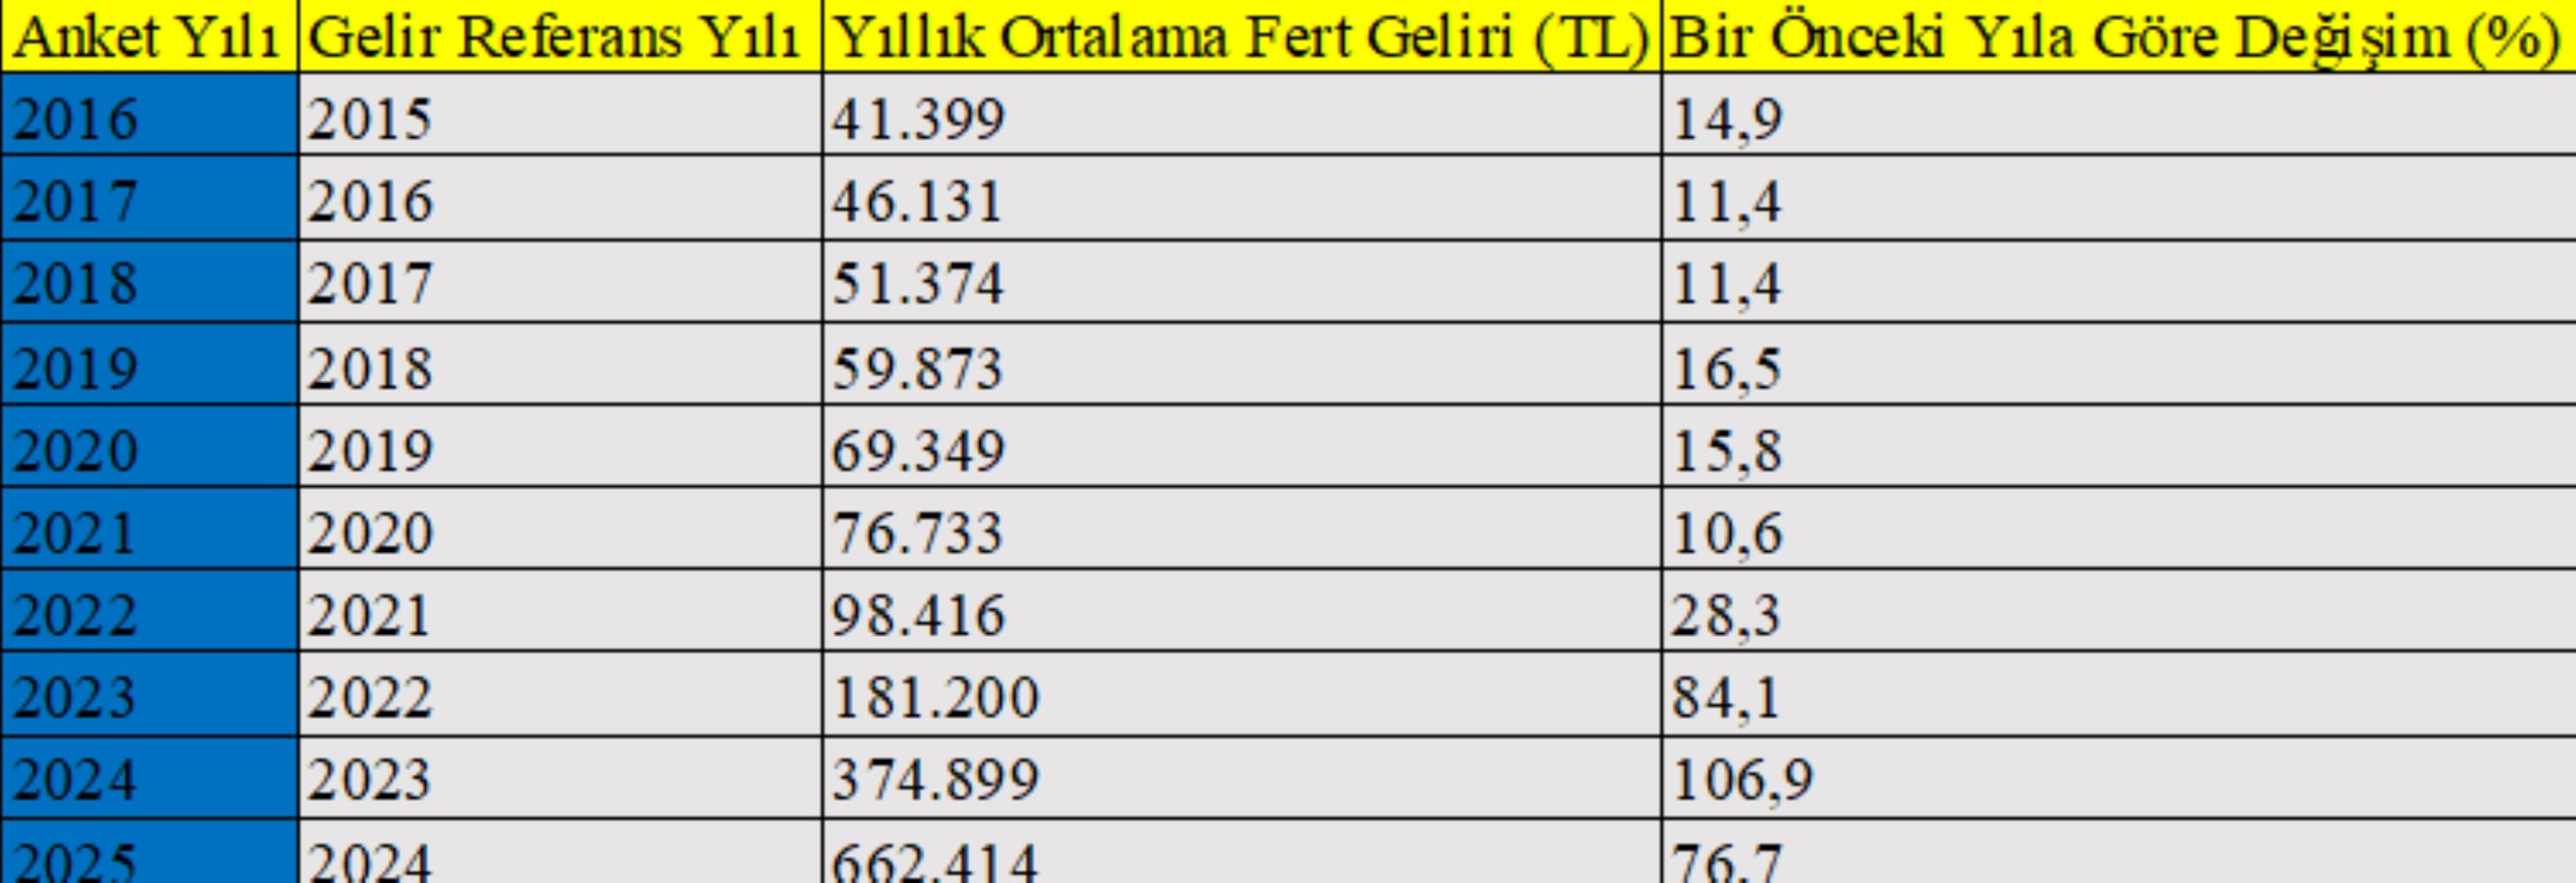
A similar trend is seen in the annual average equivalized household disposable per capita income, as can be seen in the table below. The annual average per capita income, which was 19 thousand 139 TL in 2016, has risen to 332 thousand 882 TL in 2025, an increase of 77.3% compared to the previous year. The growth rates in the last three years clearly show how rapidly incomes have inflated in nominal terms in Turkey. However, a critical question arises at this very point: to what extent does this increase improve the actual living conditions of households?
The answer becomes clearer when read together with the reality of high inflation. Sharp price increases in basic expenditure items, especially food, housing, energy, and transportation, during the same period have increased the pressure on household budgets. While incomes are rising, the share of mandatory expenses is also growing. For this reason, the rise in average incomes often turns into a struggle to stand still in the face of the cost of living, rather than an increase in prosperity for broad segments of society.
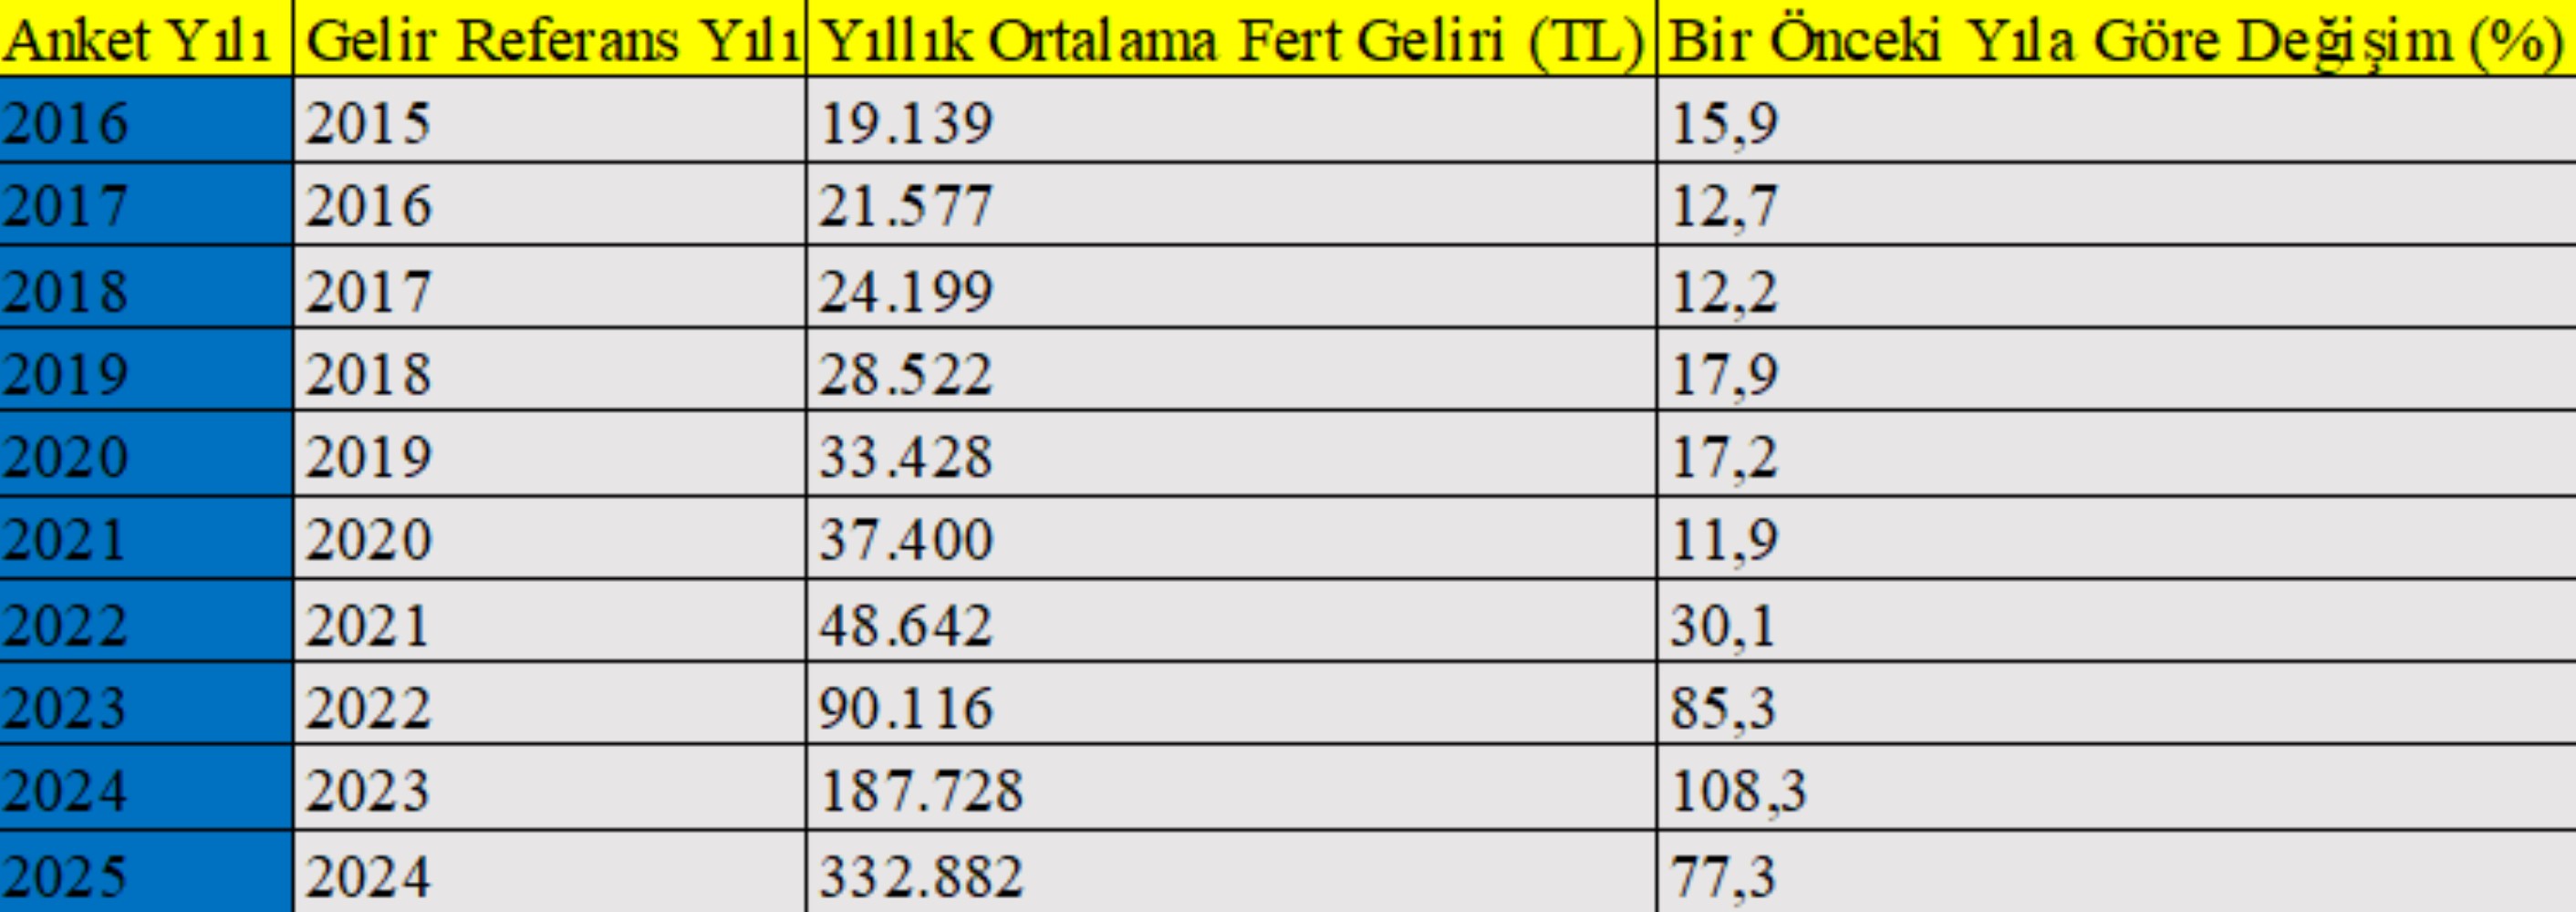
The picture is even more striking, especially for fixed-income employees, retirees, and lower-middle income groups. Nominal income increases are largely trying to compensate for price increases; households are focusing on maintaining their current living standards rather than living better. This situation shows that the distance between income statistics and daily life is widening.
The emerging picture clearly reveals that the link between economic growth and quality of life has weakened. While the numbers are rising rapidly, purchasing power is not increasing at the same speed; income growth is not sufficiently reflected in households' tables, housing conditions, and sense of confidence in the future. In short, incomes are growing in Turkey, but life is becoming more expensive; while statistics are improving, the sense of prosperity and purchasing power are not strengthening to the same extent.
INCOME STRATIFICATION BY HOUSEHOLD STRUCTURE: Structural Income Disadvantage in Crowded Households
To understand how income growth is reflected in different segments of society, it is not enough to look only at averages; it is necessary to look closely at household structure. TÜİK data clearly reveals that income inequality in Turkey has not only an individual but also a demographic and structural character. In the same economic environment, different household types cannot benefit equally from income growth.
According to the table below; as of 2025, the household type with the highest annual average equivalized household disposable per capita income is single-person households. In this group, the average income increased by approximately 194 thousand TL compared to the previous year, reaching 418 thousand TL. Single-person households differ significantly from other household types in terms of both income level and income growth rate. This picture suggests that individual income increases become more visible in structures without the pressure of intra-household sharing.
While the annual average equivalized per capita income in households consisting of more than one person without a nuclear family is at the 386 thousand TL level, this figure remains at 338 thousand TL in households consisting of a single nuclear family. Incomes are increasing in both household types; however, the per capita effect of the increase is significantly weaker compared to single-person households.
The lowest income levels are seen in crowded households where other people live in addition to at least one nuclear family. In this group, the annual average equivalized per capita income remains at the 264 thousand TL level, and the annual increase amount is more limited compared to other household types. As the household grows, income growth rapidly erodes; resources per capita become insufficient in the face of living costs.

This picture clearly reveals why the risk of poverty is higher in families with children and crowded families. Even if income increases, the growing household population shares this income; mandatory expenses such as housing, education, transportation, and food grow rapidly. As a result, income growth can dissipate without turning into prosperity.
The reality that emerges shows that it is not enough for income policies to focus only on individual earnings. Social policies designed without taking into account household size, number of children, and intra-household dependency ratio carry the risk of making inequality invisible rather than reducing it. Even if average incomes rise, vulnerability and poverty can become permanent for crowded households. This situation shows that income growth does not automatically turn into social prosperity, and that household structure plays a decisive role in this transformation.
For this reason, it is not enough for social policy discussions to focus only on individual income levels. The data clearly reveals that social support and redistribution mechanisms should be handled with an approach that takes into account household size, number of children, and intra-household dependency ratio. Otherwise, even if average incomes rise, the risk of poverty and vulnerability can become permanent for crowded households.
THE NEW ERA OF WORKING POVERTY: Salaries are Rising, Life is Not Easing
The distribution by income type clearly reveals what sources household incomes in Turkey are based on and how this structure is transforming. As of 2025, the highest share in total income belongs to salary and wage income at 49.7 percent. The fact that this share has increased compared to the previous year might seem like a positive development in favor of the working class at first glance. However, when the real equivalent of this increase is questioned in a high-inflation environment, the picture points to a much more limited improvement.
Although the share of wage income in total income is increasing, this increase is not enough to significantly raise the living standards of households. Wages are largely trying to catch up with rising prices; they are often limited to compensating for the rise in the cost of living. For this reason, for employees, income growth turns into a constant balancing struggle against the cost of living rather than an increase in prosperity.
The fact that the share of entrepreneurial income, which has the second largest share after salary and wage income, fell to 18.3 percent in 2025 shows that the income squeeze is deepening, especially for small tradesmen and the self-employed. The fact that the share of agriculture in entrepreneurial income remains limited at 15.6 percent clearly reveals why income growth in rural areas cannot create permanent prosperity.
The rise in the share of social transfers in total income to 18.2 percent shows that state support is becoming increasingly decisive in terms of household income. This increase can be read as a sign that the social state is strengthening, but it is also an indicator that a large segment cannot make a living with market incomes. Indeed, the fact that the share of retirement, widow, and orphan pensions in social transfers has reached 89.3 percent reveals that the livelihood of millions of households depends directly on public support.
There is also a striking picture in other income items. While the increase in the share of securities income shows that segments with financial assets are diversifying their incomes, the fact that the shares of daily wage income and real estate income remain limited reveals that low and irregular income groups maintain their vulnerable position within the system.
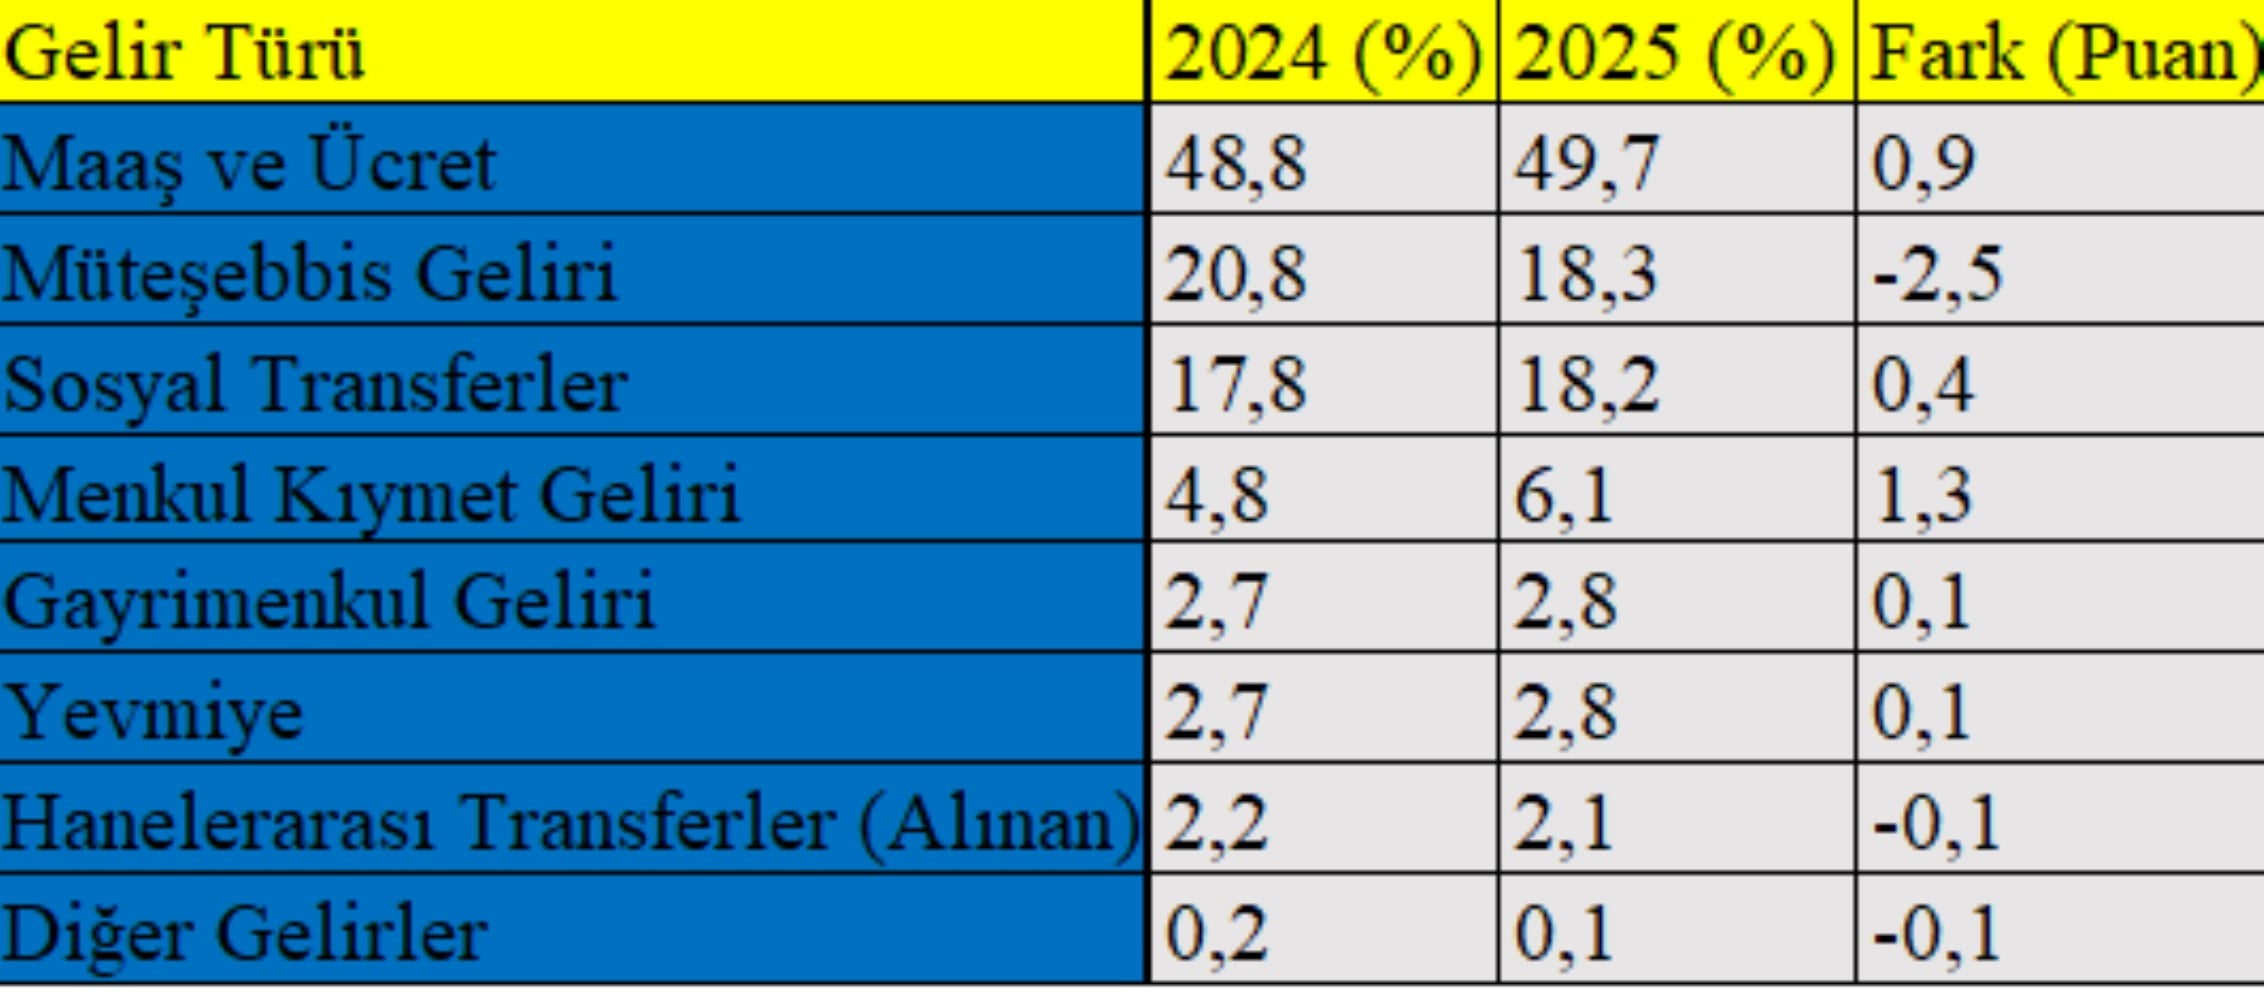
This emerging structure offers important clues about the nature of income growth in Turkey. Wage incomes are increasing, but for most households, it is "not enough" in the face of the cost of living. The increasing weight of social transfers shows that economic vulnerability is becoming widespread and that state support has ceased to be complementary for many households and has turned into a basic income element. As a result, the income composition is changing; however, this change bears the traces of a struggle to survive rather than an increase in prosperity.
THE DETERMINING ROLE OF EDUCATION IN INCOME DISTRIBUTION: As Education Increases, Income Leaps
The relationship between education and income clearly reveals that income inequality in Turkey is a problem not only of today but also of the future. TÜİK data shows that as the level of education increases, not only the income level but also the rate of income growth increases significantly. This situation suggests that inequality has turned into a structure that reproduces itself over time.
According to the table below; as of 2025, the annual average main job income has reached 566 thousand TL for higher education graduates. The same indicator remains at 376 thousand TL for high school and equivalent school graduates, 290 thousand TL for those with less than high school education, and only 183 thousand TL for those who have not completed any school. This approximately three-fold difference between the highest education group and the lowest education group strikingly reveals the determining role of education in income distribution in Turkey.
Income growth rates also reinforce this picture. In the 2024–2025 period, the highest increase in annual average main job income occurred among higher education graduates with 83 percent. The fact that the increase rate remained at 56.7 percent for high school and equivalent school graduates shows that the secondary education level received a relatively smaller share of income growth. Although increase rates appear higher for those with less than high school education and those who have not completed any school, the absolute income gap does not close due to low starting levels.
Gender breakdown deepens inequality even further. While the annual average main job income of men rose to 431 thousand TL in 2025, this figure remained at 332 thousand TL for women. Although it is noteworthy that women's income growth rates are relatively higher as the education level increases, the absolute income gap is maintained. While income growth was 84.9% for women with higher education, this rate was 82.1% for men in the same group. Despite this, the absolute income gap continues to be maintained.
 This picture shows that inequalities in access to education shape not only individual incomes but also the social income structure in the long run. Segments that can access higher education both earn higher incomes and receive a faster share of economic growth. Low-educated groups face the risk of being permanently stuck in the lower ranks of income distribution.
For this reason, education must be handled not only as an individual investment area but as one of the most fundamental tools of income justice and social equality. It does not seem possible to permanently reduce injustice in income distribution without eliminating inequality in education. Otherwise, education continues to function as a mechanism that reproduces inequality rather than reducing it.
SECTORAL INCOME DISTRIBUTION: There is Growth, Agriculture is Out! The Income Gap Between Sectors is Deepening
Sectoral income distribution clearly reveals that economic growth in Turkey does not produce simultaneous and balanced prosperity in all areas. 2025 data shows that while incomes are rising rapidly in some sectors, a permanent state of being left behind continues in some areas. The agricultural sector is significantly behind in terms of both income level and growth rate. There is growth; however, this growth is not shared fairly among sectors.
According to the table below; while the annual average main job income reached the 426 thousand TL level in the service sector in 2025, it was 399 thousand TL in the industrial sector and 402 thousand TL in the construction sector. In contrast, the annual average main job income in the agricultural sector remained at only 237 thousand TL. In a picture where the average of all sectors is approximately 403 thousand TL, the fact that agriculture remains well below this level clearly shows why income insufficiency in rural areas has become permanent.
A similar divergence is noteworthy when income growth rates are examined. In the 2024–2025 period, the highest income growth was seen in the construction sector with 79 percent, while this rate was 75.8 percent in the service sector and 70.1 percent in the industrial sector. In the agricultural sector, the growth rate remained at 54.4 percent, significantly behind other sectors. This picture reveals that agriculture is stuck not only with a low income level but also with a low income growth rate.
Although the high nominal increases observed in the construction and service sectors present a positive picture at first glance, the extent to which these increases are permanent and secure is debatable. Especially in the construction sector, periodic growth, volatile employment, and a fragile income structure make it difficult for rising numbers to turn into sustainable prosperity. In the service sector, although the average income is relatively high, precarious working forms within the sector and wide wage distribution hide the inequalities behind the average figures.
The picture that emerges in the agricultural sector points to a much more structural problem. Low income level, limited growth rate, and high uncertainty explain why rural poverty has become permanent. This income structure in agriculture deepens regional inequalities, accelerates migration from rural to urban areas, and increases the pressure on the labor market in cities.
As a result, sectoral income data clearly reveals that growth in Turkey is not reflected equally in all areas; especially that agriculture experiences a permanent income disadvantage. This picture reminds us once again that sectoral policies should focus not only on production increases but also on structural transformations that will improve income distribution.
Table: Change in Annual Average Main Job Incomes by Sector

STATUS AT WORK SHARPENS INCOME: The Employer Wins, the Employee Settles
One of the areas where income inequality becomes most sharply visible in Turkey is the income differences formed according to status at work. TÜİK data clearly reveals that individuals working in the same economy are placed in entirely different income worlds depending not only on what they do but also on the status in which they do the work. This picture shows that inequality in the labor market has acquired a structural character.
According to the table below; as of 2025, the annual average main job income has reached the 1 million 204 thousand TL level for employers. In contrast, the annual average income of paid and salaried employees is calculated as 379 thousand TL, the income of the self-employed as 348 thousand TL, and the income of daily wage earners as only 186 thousand TL. The difference between employers and daily wage earners now points to a distance almost between different economic classes rather than an income difference.
When looking at income growth rates, a more balanced picture emerges at first glance. In the 2024–2025 period, the highest increase occurred among paid and salaried employees with 80.7 percent, while this rate was 76.6 percent for daily wage earners. While the increase remained more limited at 65.2 percent for the self-employed, it is noteworthy that the increase rate for employers occurred at the lowest level with 49.7 percent. However, when absolute income levels are taken into account, it is clearly seen that these growth rates are not enough to close the income gap. Employers continue to remain in the highest income group by far, despite lower growth rates.
Gender breakdown deepens status-based inequality even further. While the annual average main job income of male employers reaches 1 million 264 thousand TL, this figure remains at the 807 thousand TL level for female employers. A similar picture is the case for paid and salaried employees: the average income of men is 399 thousand TL, and the income of women is 337 thousand TL. The most vulnerable group is female daily wage earners; in this group, the annual average income is at the lowest level with 109 thousand TL.

This emerging structure explains why the concept of "working poverty" is becoming increasingly visible. Although the incomes of paid and salaried employees increase nominally, the distance between them and employer incomes does not close. For the self-employed and daily wage earners, income growth often remains at a level that is not even enough to cover basic living costs.
The fact that status at work has become so decisive shows that income inequality is fed not only by education, sector, or regional differences but also by the structure of the labor market. The narrowing of secure employment, the weakening of the bargaining power of wages, and the existence of informality sharpen this inequality even further. This picture reveals once again that income justice cannot be achieved without a stronger wage policy, a more inclusive social protection system, and regulations in favor of labor.
REGIONAL INCOME DISTRIBUTION: The Center Gets Richer, the Periphery is Left Behind
Regional income distribution data clearly reveals that economic growth in Turkey is distributed extremely unevenly geographically and that almost more than one economic reality has formed within the same country. TÜİK's 2025 data shows that there are deep and permanent regional gaps behind national averages.
While the annual average equivalized household disposable per capita income across Turkey was calculated as 332 thousand 882 TL in 2025, it is seen that this average differs extremely sharply among regions. As can be seen in the table below; the highest income level occurs in the TR51 region, which includes Ankara, with 449 thousand 618 TL. Ankara is followed by Istanbul (TR10) with 434 thousand 929 TL and Izmir (TR31) with 405 thousand 896 TL. These three major centers stand out with income levels significantly above the national average.
The TR61 region, which includes Antalya, Isparta, and Burdur, which are tourism and service-oriented, and the TR41 region, centered on Kocaeli, which is industry-intensive, also have income levels above the average. In contrast, income levels are gradually falling in a significant part of Central Anatolia, the inner parts of the Black Sea, and the east of the Mediterranean. Annual average per capita incomes are stuck in the 290 thousand TL band in the Konya–Karaman (TR52), Adana–Mersin (TR62), and Kayseri–Sivas–Yozgat (TR72) regions.
The Eastern and Southeastern Anatolia regions are concentrated at the bottom of the list. While the annual average per capita income in the TRA1 region, which includes Erzurum, Erzincan, and Bayburt, falls to 259 thousand TL; this figure falls to 239 thousand TL in the TR63 region, which includes Hatay, Kahramanmaraş, and Osmaniye. Further down are the TRB1 region, which includes Malatya, Elazığ, Bingöl, and Tunceli, and the TRC1 region, which includes Gaziantep, Adıyaman, and Kilis.
The lowest income level is seen in the TRB2 region, which includes Van, Muş, Bitlis, and Hakkari. In this region, the annual average equivalized household per capita income is 172 thousand 552 TL, which corresponds to almost half of the Turkey average. The difference between the capital Ankara and TRB2 points to a deep gap not only in terms of income levels but also in terms of quality of life, access to public services, and economic opportunities.
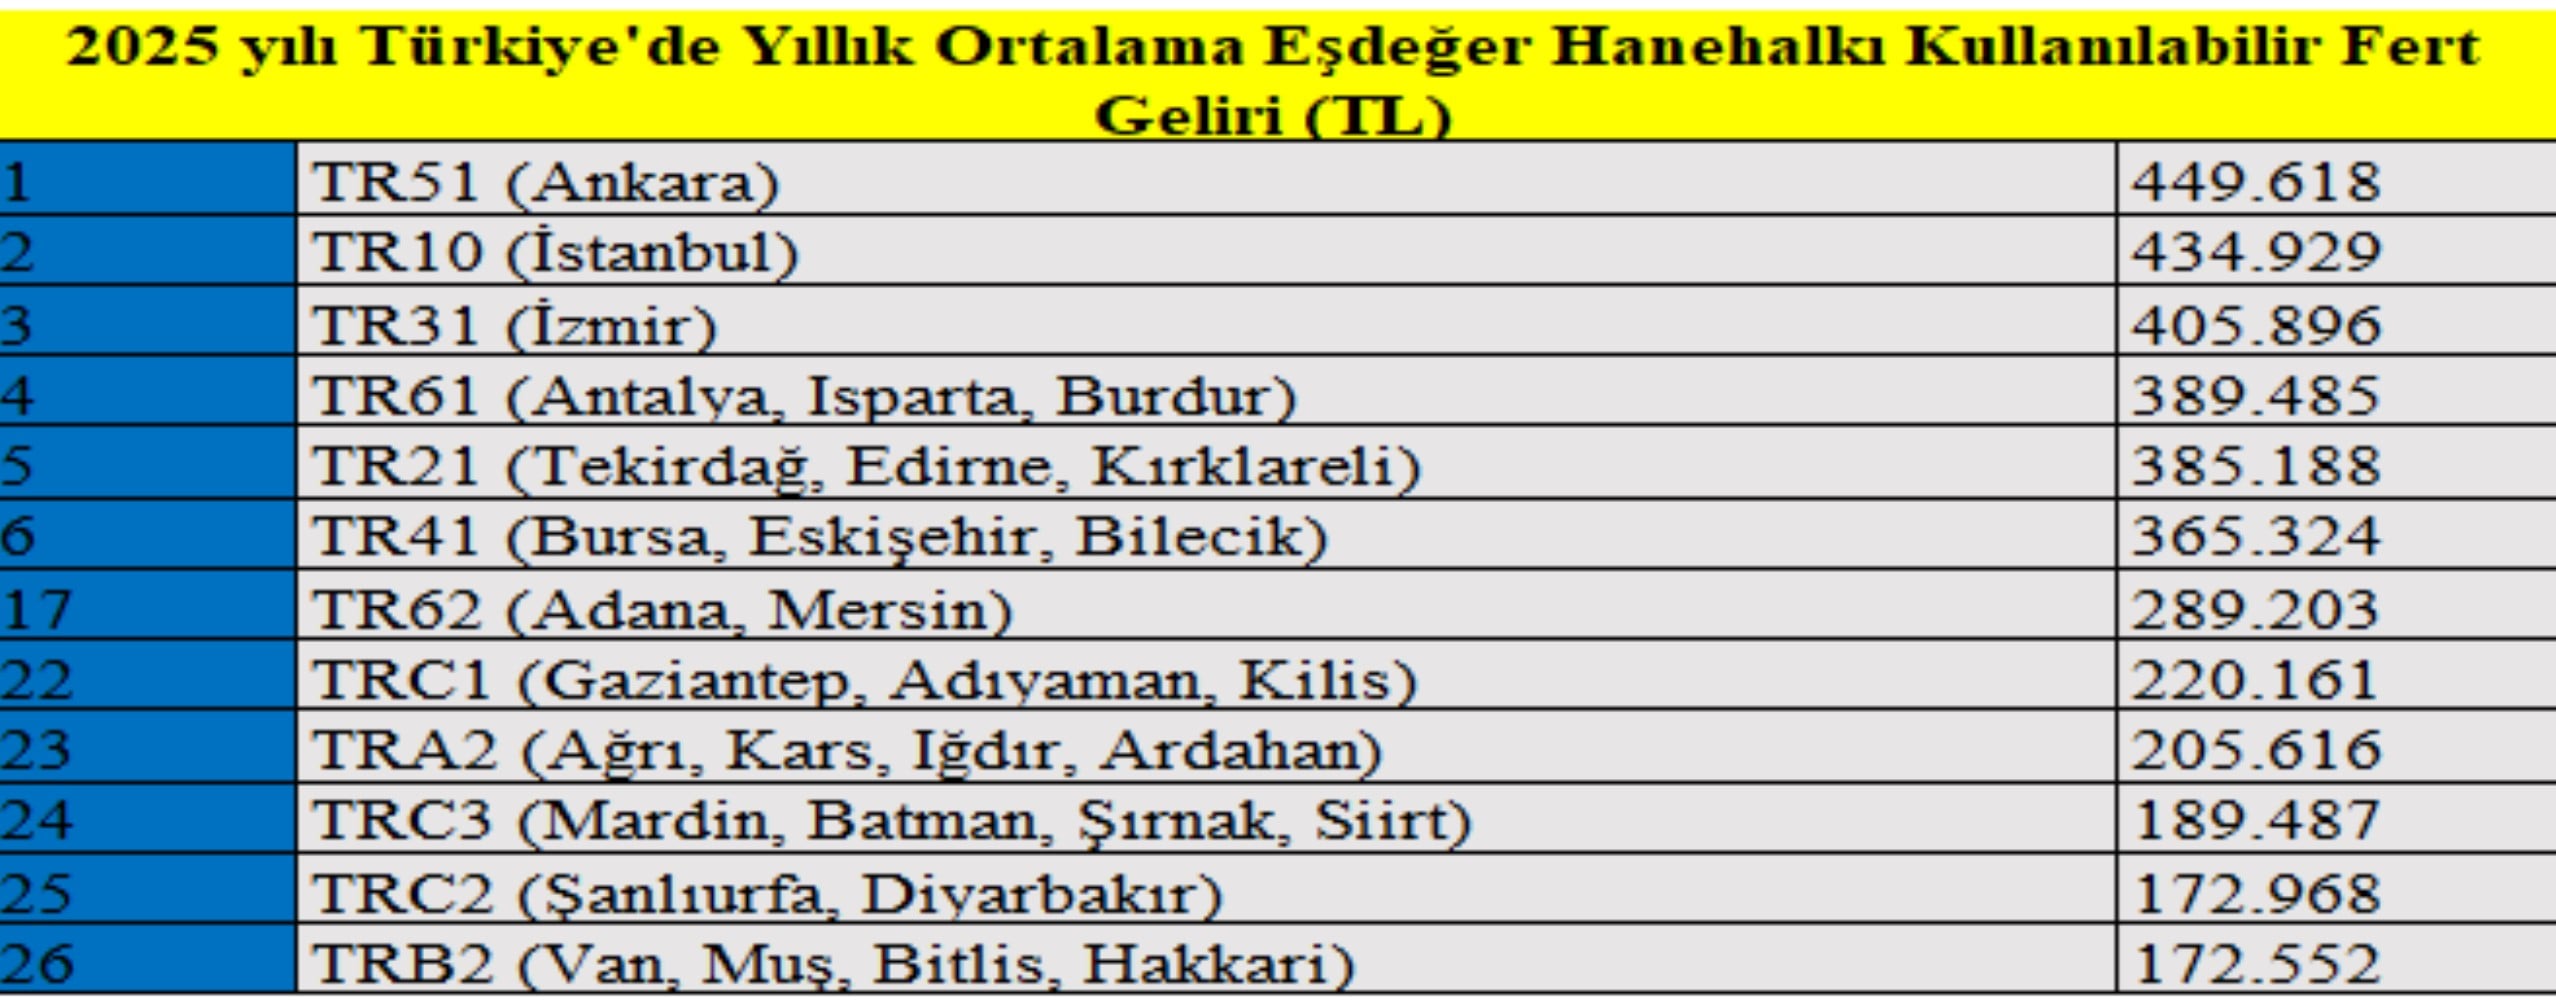
This picture also clearly reveals why regional development policies have been insufficient to close income gaps to date. While major cities and economic centers receive a larger share of growth, peripheral regions and especially eastern provinces continue to experience a structural income disadvantage. As a result, internal migration accelerates, urbanization pressure increases, and regional inequalities reproduce themselves.
There is growth in Turkey; however, this growth does not produce geographically balanced prosperity. Regional income data reminds us once again that development policies should focus not only on national averages but also on regional needs, local potentials, and areas of permanent inequality.
SAME REGION, DIFFERENT LIVES: The Intra-Regional Income Gap is Deepening
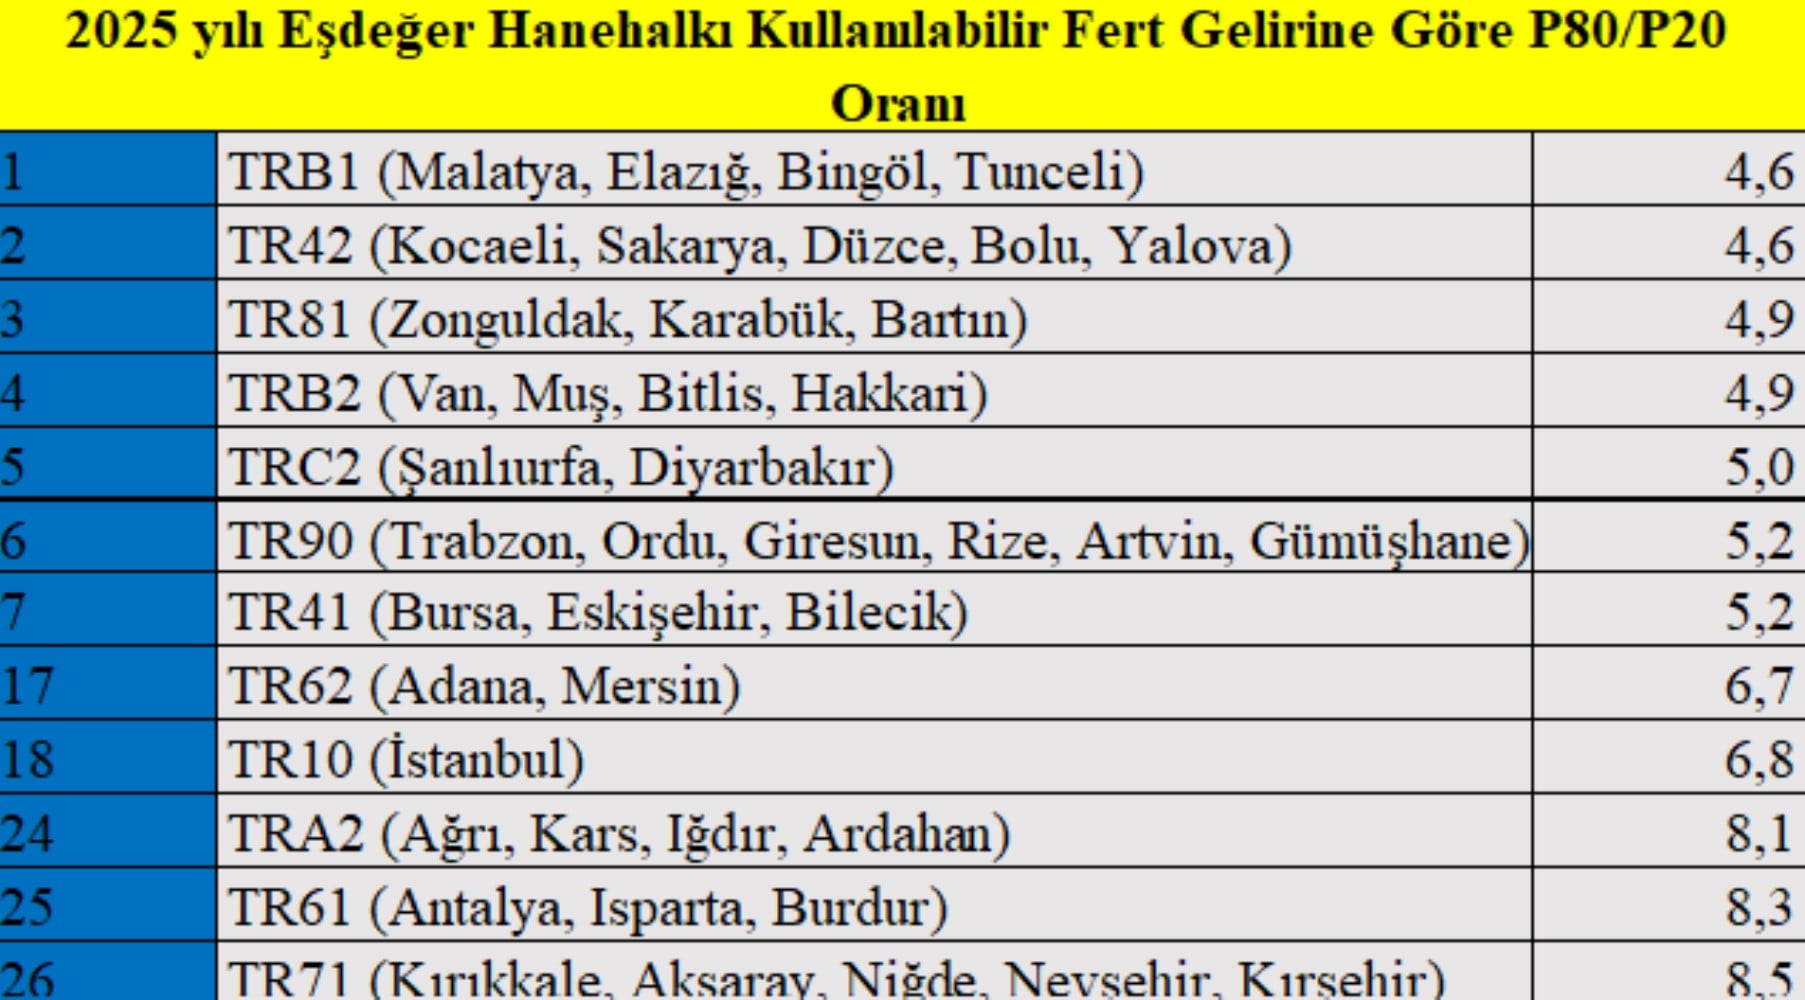
Regional data makes visible not only the differences between provinces and regions but also the income distribution within the same regions. As can be seen in the table below; TÜİK's 2025 P80/P20 ratios show that income inequality in Turkey is no longer just about the "developed-underdeveloped region" distinction; it shows that deep and permanent class stratifications are also being experienced within the region.
The fact that the richest 20 percent across Turkey earn 7.5 times more income than the poorest 20 percent reveals that growth and income increase are not reflected equally in social prosperity. However, this average carries different meanings within regions as well as among regions. While income levels generally remain weak in low-income regions, the fact that the rich-poor gap remains relatively more limited points to a picture of "generalized poverty." Everyone is poor; but because the difference between them is narrow, inequality becomes less visible.
In contrast, the picture reverses in middle and high-income regions. While average incomes rise in major cities, industry and service-oriented areas, and tourism centers, this increase is concentrated in certain segments. In centers such as Istanbul, Ankara, Izmir, and Antalya, high average incomes progress along with deep intra-regional inequalities. There is growth in these regions; however, this growth is not distributed equally to broad segments of society.
This emerging picture shows that the problem of income distribution can no longer be explained only by development differences. In the same city, and even in the same district, disconnected economic worlds are being formed. On one side, there are segments that quickly receive a share of growth, and on the other, there are households whose incomes are eroding in the face of rising costs. Even if regional averages rise, the inequality of daily life becomes more visible.
This situation makes it necessary for income policies and social interventions to focus not only on regional averages but also on inequalities within the region. Otherwise, growing regions also turn into more unequal regions; economic vitality brings social stratification along with it.
As a result, 2025 data shows that while income growth in Turkey is spreading geographically, inequality is deepening at the same speed. As long as growth cannot be inclusive even at the regional level, economic progress carries the risk of weakening social integrity rather than strengthening it.
INCOME MOBILITY IS WEAK, POVERTY IS PERMANENT: Hard to Go Up, Easy to Fall Down
One of the most important elements deepening inequality in income distribution is that mobility between income groups is extremely limited. As can be seen in the table below; panel data obtained from TÜİK's Income and Living Conditions Survey clearly reveals that poverty in Turkey has largely acquired a permanent, not temporary, character. Those born in lower income groups largely remain in the same place; upper income groups strongly maintain their positions. This situation shows that upward mobility between income groups is limited, and downward risks are significant, especially at the lower and upper ends.
According to 2024–2025 transition data, 58.9 percent of individuals who were in the lowest income group (the first 10 percent) the previous year remained in the same income bracket in 2025. In other words, nearly two-thirds of the poorest segment cannot climb the income ladder within a year. Only 21.2 percent of this group can move to a higher income group. The rate of those who rise by more than one income group remains limited and exceptional.
The picture is even more rigid in the upper income group. 68.1 percent of individuals who were in the highest income group (the last 10 percent) the previous year remain in the same group the following year. This rate shows how strongly the income position is maintained in the richest segment. Moreover, only a small part of this group experiences downward mobility; that is, staying in the upper income bracket offers a much safer position compared to lower income groups.
Limited mobility is observed in middle-income groups. A segment ranging from approximately one-quarter to one-third of individuals in the second, third, and fourth 10 percent brackets can transition to a higher or lower income group within a year. However, these transitions mostly occur between neighboring brackets. Leaps exceeding more than one step are extremely rare. This situation shows that the middle class has difficulty moving upward; and the risk of falling downward is always present.
When the data is evaluated together, the picture becomes clear: the poorest remain poor, the richest maintain their wealth. The lower and upper steps of the income ladder are largely fixed. This structure suggests that the rhetoric of equality of opportunity does not find enough response in practice; and that education, employment, and social policy channels are insufficient to strengthen income mobility.
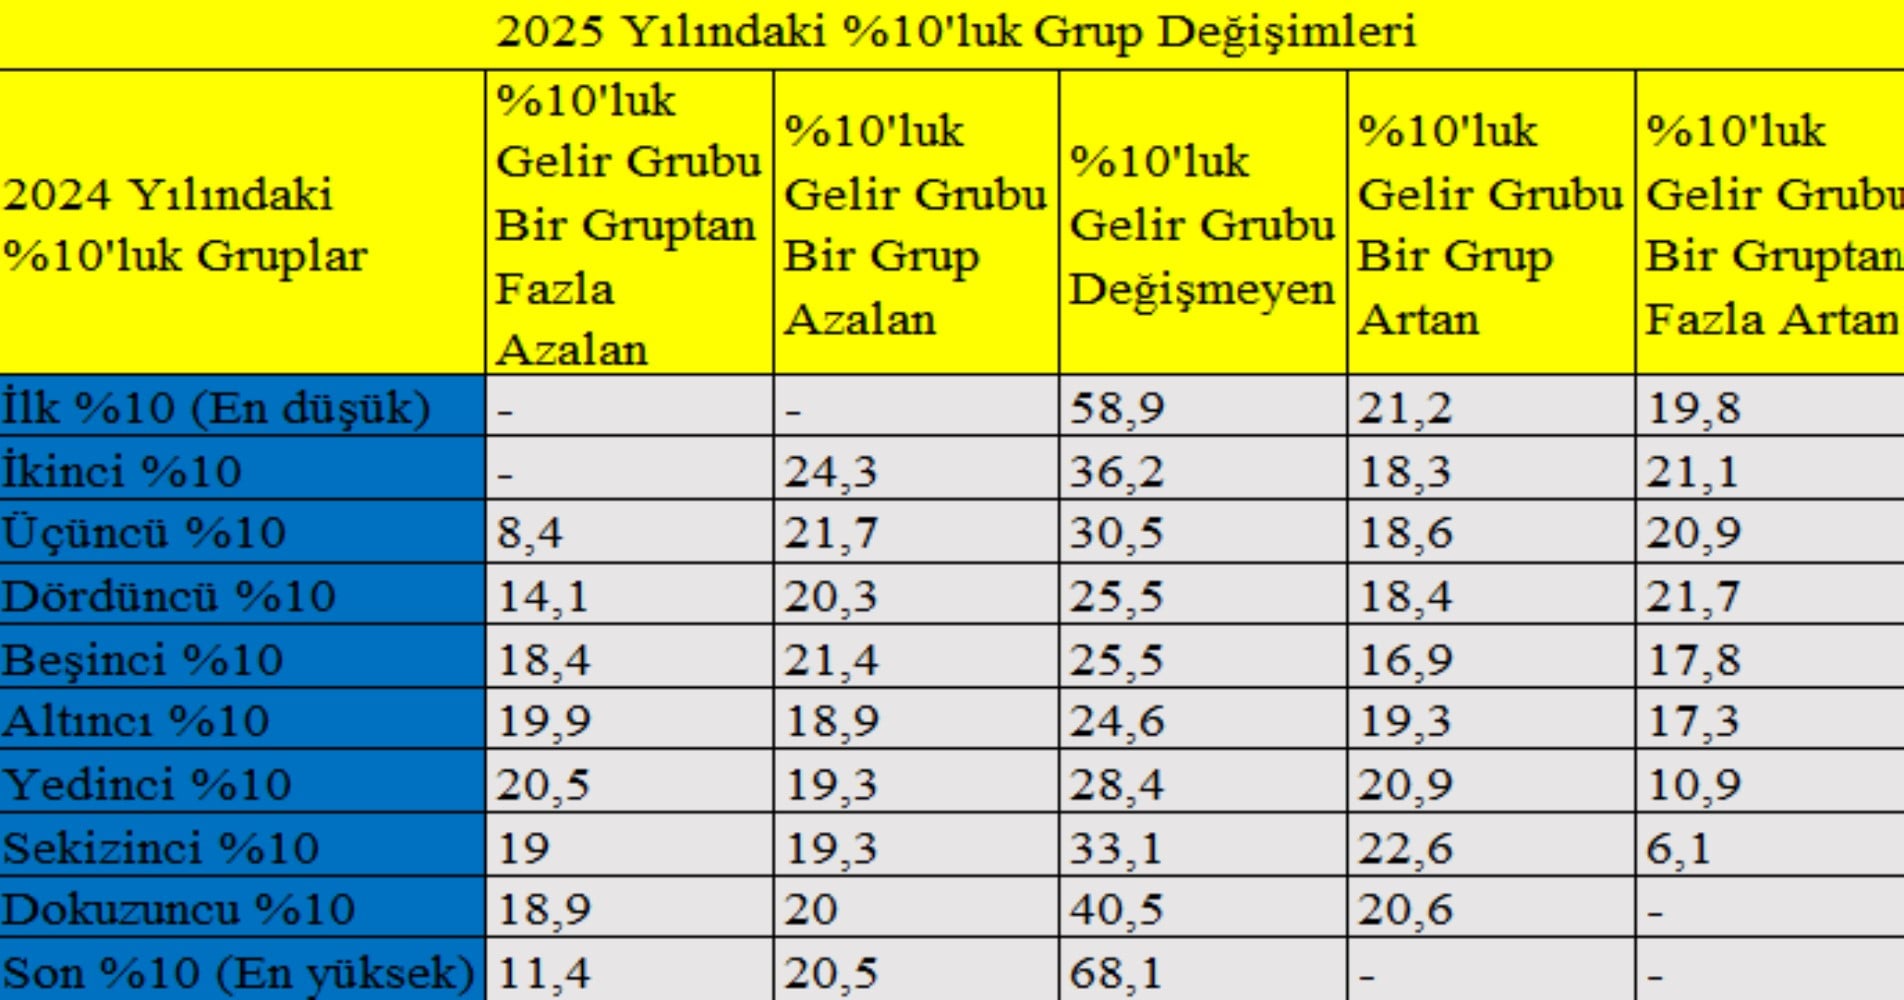
As a result, the fact that transitions between income groups are weak increases the risk of poverty being transmitted across generations. Although short-term income increases and social transfers provide temporary relief, they cannot create a structural mobility that will break permanent poverty. The table below clearly reveals that social policies should focus not only on managing poverty but also on making real and sustainable transitions between income steps possible.
STRUCTURAL VULNERABILITY IN THE LABOR MARKET: There is Work, No Security
Panel data on the labor market shows that employment in Turkey exhibits a structure that is mobile on the surface but quite fragile deep down. TÜİK's Income and Living Conditions Survey reveals that transitions from unemployment to employment exist; however, these transitions do not turn into a permanent and inclusive improvement.
As can be seen in the table below; the fact that 38.7 percent of individuals who were unemployed in 2024 started working in 2025 shows that there is a certain recovery and opportunity for transition to employment for the unemployed. However, the fact that 44 percent of the same group remained unemployed in 2025 points to the fact that unemployment has become a permanent situation for a significant segment. Even more striking is that 17.3 percent of the unemployed completely dropped out of the labor force. This rate suggests that the hope of finding a job has weakened and giving up on looking for a job has become widespread.
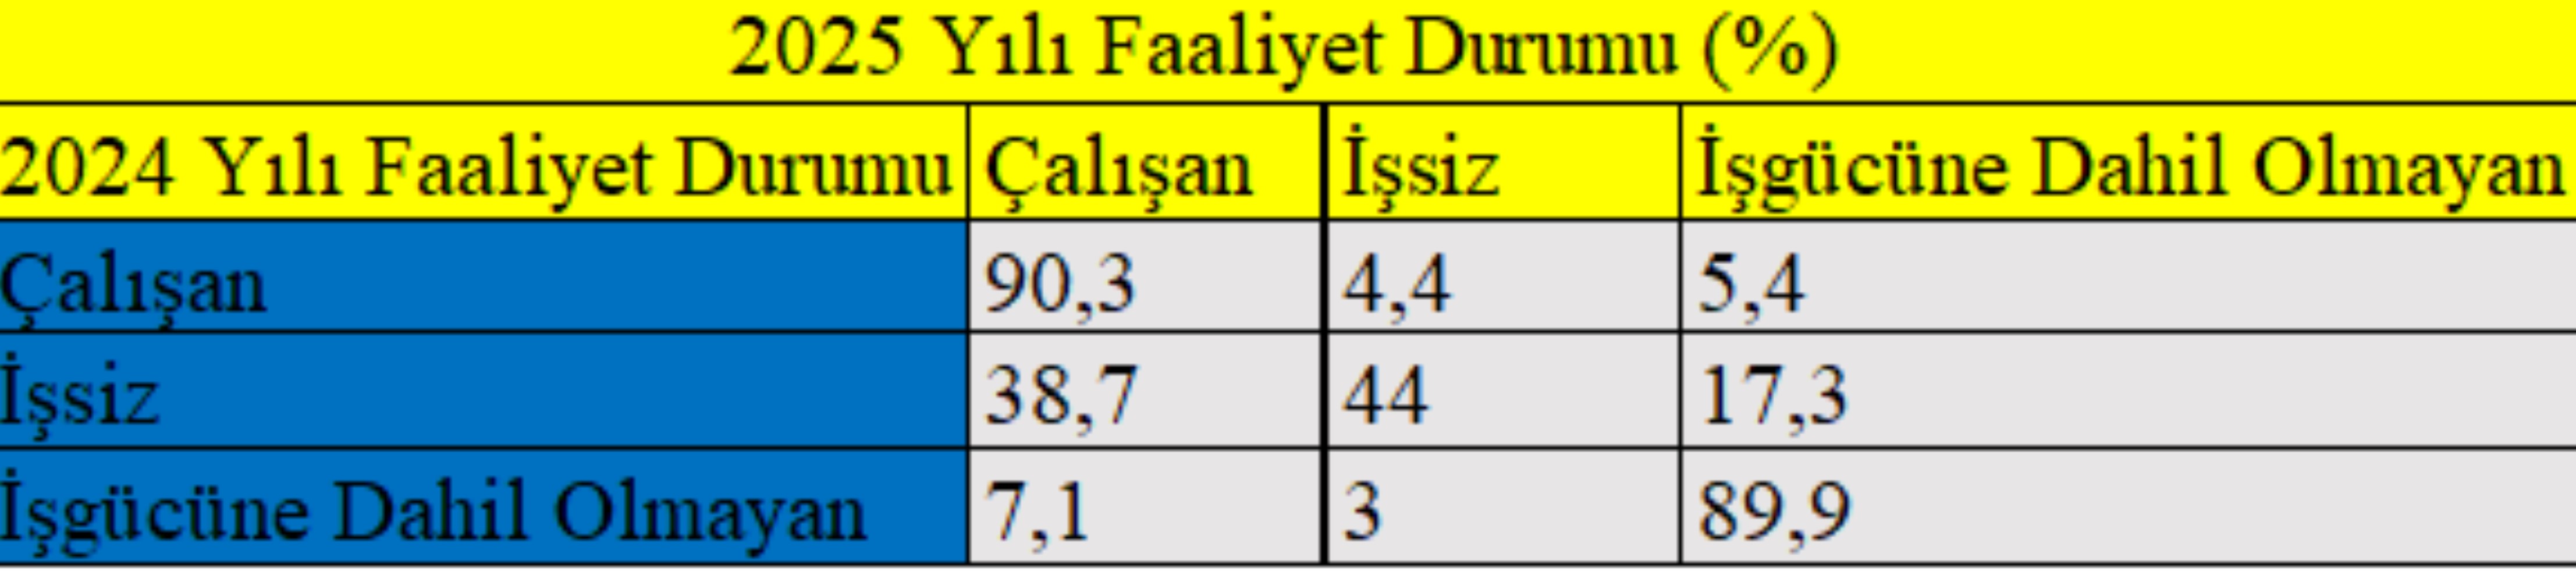 The picture is relatively more stable on the employee front. 90.3 percent of individuals recorded as employed in 2024 continued to remain in working life in 2025. Although this situation points to a strong continuity for those who remain in employment, it also shows how closed a structure the labor market has. The fact that 4.4 percent of employees fell into unemployment and 5.4 percent dropped out of the labor force reveals that vulnerability continues, especially for those working in precarious and low-wage jobs.
Mobility is extremely limited in the population not included in the labor force. 89.9 percent of individuals not included in the labor force in 2024 maintained this status in 2025. Only a 10.1 percent segment can participate in the labor force. The fact that 7.1 percent of this group started working and 3 percent entered the labor force as unemployed shows that participation in the labor force is still dependent on difficult and limited conditions.
When this picture is evaluated holistically, continuity on the one hand and permanent vulnerability on the other continue to exist simultaneously in the employment market. While the majority of employees remain within the system, a significant portion of the unemployed are stuck in unemployment; those not included in the labor force have difficulty getting out of this situation. Even if employment growth exists quantitatively, it does not produce an inclusive and sustainable mobility.
As a result, this structure in the labor market becomes one of the fundamental mechanisms feeding inequality in income distribution. As long as employment areas that provide secure, stable, and sufficient income do not expand, finding a job does not mean escaping poverty on its own. There is employment; however, this employment often reproduces vulnerability rather than reducing it.
COMPARISON WITH OECD AND DEVELOPED COUNTRIES: Where Does Turkey Stand?
To correctly read the picture regarding income distribution in Turkey, it is necessary to evaluate this data together with OECD countries and developed economies. Because income inequality is not only an intra-country problem; it is also a fundamental area of comparison that shows countries' growth models, social state capacity, and the effectiveness of redistribution policies.
As can be seen in the table below; the Gini coefficient, which measures income distribution in OECD countries, hovers in the 0.30–0.32 band on average. While this rate falls to the 0.25 level in Scandinavian countries, it is in the 0.26–0.27 range in major economies such as Germany, France, and the Netherlands. In Turkey, the fact that the Gini coefficient is at the 0.41 level reveals that income inequality is significantly above the OECD average. Even more striking is that this coefficient rises to 0.473 when social transfers are excluded. This situation shows that market incomes in Turkey produce a highly unjust structure on their own and that social state mechanisms are insufficient to limit this inequality.
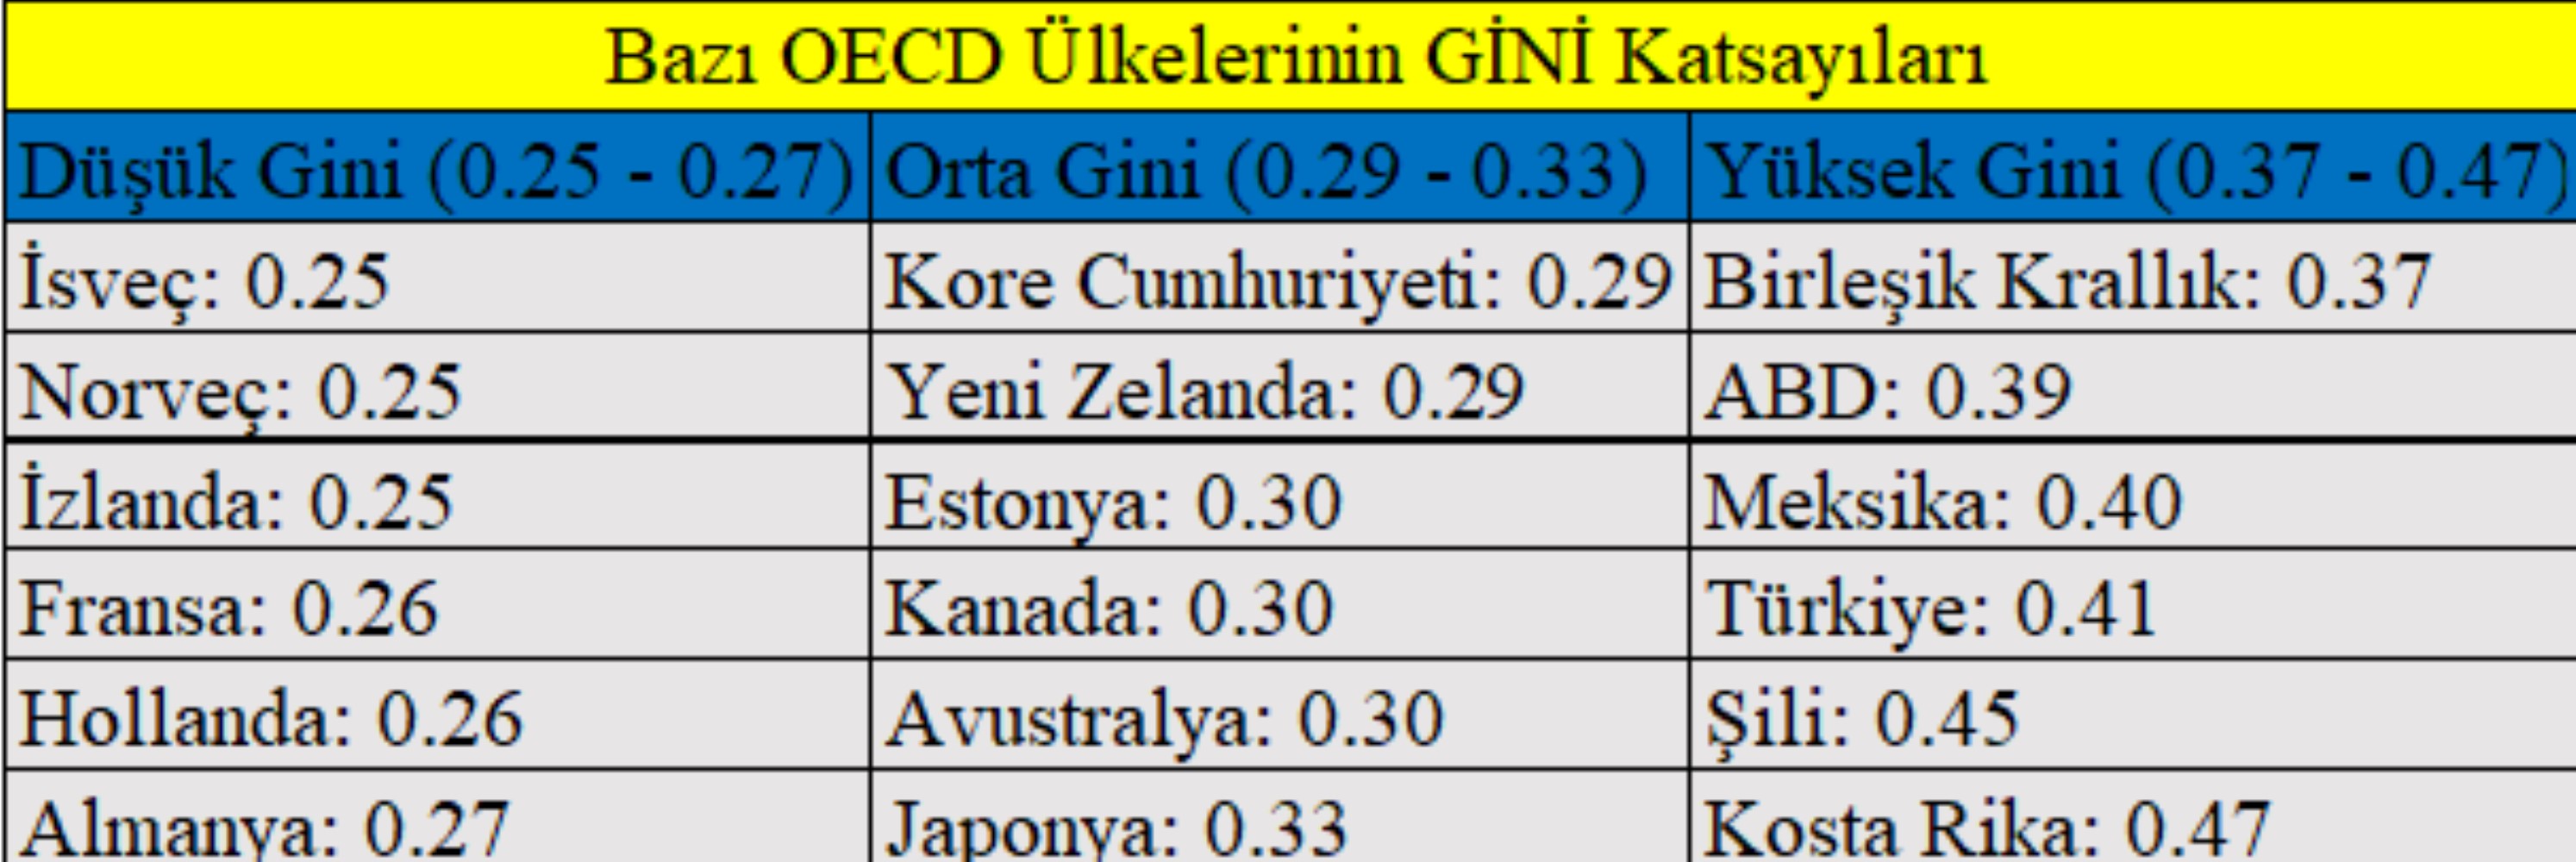
The distribution of income between the top and bottom segments also draws a similar picture. While the share of the richest 20 percent in total income generally hovers in the 35–40 percent range in OECD countries, this rate has reached 48 percent in Turkey. In contrast, while the share of the bottom 20 percent in the lowest income group is in the 8–10 percent band in the OECD average, it remains at the 6.4 percent level in Turkey. This difference shows that inequality in Turkey stems not only from the strengthening of the upper income group but also from the systematic lagging behind of the lower income group.
When viewed in terms of average income increases, a more complex picture emerges. Average household incomes in Turkey are increasing rapidly in nominal terms and exhibit an acceleration approaching many OECD countries. However, while this increase turns into real prosperity in developed countries thanks to low inflation, strong social services, and widespread public support; it largely erodes in Turkey due to high inflation. While households in OECD countries allocate a more limited portion of their income to food, housing, and energy, the share of basic needs in the budget is growing in Turkey. The same income increase produces very different life outcomes in different countries.
The share of wage income in total income also clarifies this divergence. While wage incomes generally constitute nearly 60 percent of total income in OECD countries, this rate remains at 49.7 percent in Turkey. Moreover, while wages are protected in developed countries thanks to strong union structures, collective bargaining mechanisms, and low inflation; wage increases in Turkey often lag behind price increases. This situation makes working poverty much more widespread and permanent compared to OECD countries.
In terms of the relationship between education and income, Turkey also diverges negatively from the OECD average. While education functions as a tool that reduces inequality in developed countries; it carries the risk of turning into a mechanism that reproduces inequality within the existing structure in Turkey. Similarly, regional income differences are also much deeper compared to OECD countries. The income gap between major cities and eastern and southeastern regions points to a spatial inequality on a scale rarely seen in developed economies.
These comparisons clearly reveal that income inequality in Turkey stems not only from a lack of growth; but from the nature of growth, the weakness of the tax and transfer system, and the limited impact of social policies. Turkey is growing; however, unlike OECD countries, it cannot redistribute this growth fairly. Ultimately, the emerging picture reveals the reality of an economy that is growing but cannot share fairly, with all its clarity.
LOCAL GOVERNMENTS AND SOCIAL MUNICIPALISM: The Compensatory Role of Local Governments
Income inequality has ceased to be a problem monitored only in macroeconomic indicators; it has turned into a daily life issue felt in the neighborhood, at the market, in public transportation, and in the kitchen. For this reason, local governments stand out as the most concrete, fastest, and closest area of intervention to the citizen against income injustice. The regional, household-based, and income-type-dependent inequalities revealed by TÜİK data show that social municipalism has become a necessity, not a choice.
For low-income households, food support, fuel aid, student scholarships, and social services offered by municipalities become fundamental balancing elements that reduce the vulnerability created by inequality. City restaurants, public bread applications, social markets, and transportation subsidies stand out as direct intervention tools aimed at alleviating working poverty in an environment where wages are insufficient.
For families with children and crowded families, nursery services, free or supported school nutrition, and education aid not only alleviate the burden of today; they also directly affect future income distribution. Because access to education and care services stands out as one of the most effective ways to break the intergenerational transmission of poverty. In rural areas and regions with low income levels, cooperativism, local producer markets, projects supporting women's labor, and local development initiatives offer critical mechanisms that bring social aid together with production. Such applications present a more sustainable approach that increases income-generating capacity, not just income transfer.
However, the impact of social municipalism remains limited to the financial and administrative capacity of local governments. In a period when income inequality is deepening so much, central and local social policies need to be placed in a compatible and long-term framework that complements each other. Otherwise, local governments remain as actors that can only compensate for a structural problem to a limited extent.
CONCLUSION: Unshared Growth Does Not Produce Prosperity
TÜİK's 2025 Income Distribution Statistics show that the Turkish economy is growing numerically; average incomes are rising, and the total pie is expanding. However, the same data also clearly reveals that this growth does not turn into a permanent increase in prosperity for broad segments of society. While income is concentrated at the top, wages are losing value in the face of high inflation; the lower and middle class are standing still, and inequality is moving from being a temporary fluctuation to settling into a permanent structure.
In this picture, the problem is no longer "is there growth?"; it is who the growth is working for. In an economy where the top income group maintains its share, income mobility is weak, and regional gaps are deepening, growth is increasingly losing its social response. While the numbers are rising, the daily life of households is becoming more fragile and uncertain; expectations for the future are narrowing, and social risks are growing. For this reason, the issue is not just the question of "who earns how much," but "who lives how safely."
The current picture makes it necessary to question Turkey's growth model structurally. In an order where wage incomes are eroding in the face of inflation and social transfers are becoming a basic support for more and more households, growth alone does not produce prosperity. As inequalities extending from education to sectoral structure, from regional differences to household composition deepen, the distance between the rhetoric of economic success and social reality is widening.
Comparisons with OECD countries also offer a powerful mirror at this point. Countries that can provide a fairer income distribution with similar, or even lower, growth rates show that what is decisive is not the speed of growth, but its nature and redistribution capacity. In Turkey, growth often reproduces inequality instead of reducing it because it is not shared sufficiently and fairly.
Under these conditions, social policy must be handled not as a secondary or temporary area, but as an essential element of economic stability and social peace. A fairer and more inclusive orientation in a wide area, from tax policies to wage regulations, from education investments to regional development strategies, seems inevitable. The compensatory role undertaken by local governments stands out as one of the most concrete responses to this need in the field.
As a result, for growth to be permanent and sustainable, it depends more on how this increase is shared than on the numbers rising. As injustice in income distribution deepens, poverty becomes permanent; economic and social development weakens. In a picture where the majority of society does not see itself as part of this growth, improvement in economic indicators does not carry the meaning of real success. Otherwise, growing numbers turn into a curtain covering up shrinking lives; instead of closing the distance opened by inequality, they only make it invisible.
Would you like to get notifications about new developments and save news?
- NotificationsNew developments and breaking news
- SaveNews is stored in the app
Most Read

National Anthem surprise from Japanese Ambassador

Diesel protest in Italy brings roads to a standstill

Kılıçdaroğlu sends formal notice to YENİ Party

Diyanet Foundation, which claimed 'we have no resources,' owns 73 percent of the fund!

Is it time for the Turkish Parliament to revoke its 31-year-old 'Casus Belli' decision?

No to the 'opening' bar masked as change, yes to the Republic's bar

Ezel Akay and his brother's test results came back positive

Why is Paris burning? The crisis of the welfare state and the revolt of social justice

'From a Journalist’s Pen: The Tüfekli File'

The politics of particles and the financing puzzle: 'Calamitous questions'